Spectral Analysis
Historical document, translated for reference. It reflects medical knowledge of the 1920s–30s and is not medical advice.
Summary
Spectral analysis is a method that uses spectra produced by bodies when heated or when light passes through solutions. It was discovered in 1859 by Kirchhoff and has since expanded its applications, particularly in clinical laboratories for analyzing blood and urine for diagnostic purposes.
Encyclopedia article (1928–1936)
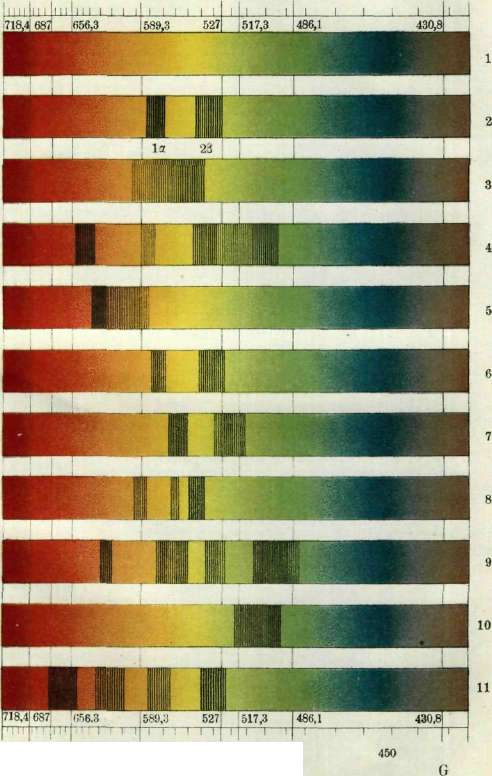
SPECTRAL ANALYSIS, one of the methods of analysis, in which are used the spectra (see Spectroscopy, spectroscope) given by this or other bodies when heated or when rays giving a continuous spectrum are passed through solutions. For the investigation of solutions and for obtaining absorption spectra of various pigments, the solar ray can also be successfully used as a source of light, which itself gives an absorption spectrum, as evidenced by the presence of Fraunhofer lines in it. Fraunhofer lines are narrow strips crossing the solar spectrum, while the bands of the spectra of pigment solutions are quite wide and can be easily distinguished from Fraunhofer lines, although essentially both represent traces of rays delayed by pigment solutions or by heated vapors or gases. Fraunhofer lines were discovered in 1802 by the German scientist Fraunhofer. They play a major role for orientation purposes. Thanks to them, the entire spectrum is divided into certain sections, and this facilitates determining the location of the bands or lines being studied. Determination of the wavelengths corresponding to different colored rays was carried out by Fraunhofer by means of a diffraction grating, and therefore, by observing the solar spectrum according to Fraunhofer lines, one can determine not only the location of the band but also the wavelengths themselves, expressed in mμ. S. a. was discovered in 1859 by Kirchhoff, and since then the scope of its application has constantly expanded. In recent years it has begun to find application in clinical laboratories for the investigation, mainly, of blood and urine for diagnostic purposes. Solutions of the blood pigment-hemoglobin (Hb)-are capable of absorbing certain rays that make up the white solar ray, and therefore when examining in a spectroscope such a solar ray that has passed through an Hb solution, we will observe the so-called adsorption spectrum, or absorption spectrum of Hb, i.e., along with narrow Fraunhofer lines we will see rather wide dark bands in different parts of the spectrum, 10-30 mμ wide. Each pigment has its own absorption bands, and according to these bands, according to their location, one can judge the presence of one or another pigment. Thus, for example, oxyhemoglobin present in the normal blood of a healthy person gives a spectrum with 2 absorption bands I λ = 589-577 mμ and II λ =556-536 mμ. To obtain this spectrum, it is necessary to dilute the blood at least 200 times. With less dilution, both bands may merge and give one continuous absorption band. Undoubtedly, the width of the vessel in which the blood solution is located also plays a role in this. When 1-2 drops of ammonium sulfide [(NH4)2S] are added to this solution, the picture changes: a spectrum of reduced, reduced Hb is obtained with one broad band λ =596-543 mμ. In case of poisoning with carbon monoxide, the pigment carboxyhemoglobin appears in the blood, characterized by a spectrum with 2 absorption bands shifted somewhat toward the violet end of the spectrum compared to the spectrum of oxyhemoglobin. The wavelengths of the absorbed rays are I λ =579-564 and II λ =548-530 mμ. When this solution is restored with ammonium sulfide, the picture should not change if the amount of carboxyhemoglobin is 15-20% according to Ziemke and 10% according to Schumm. In case of aniline poisoning, the pigment methemoglobin appears in the blood, again giving a characteristic spectrum. But to detect it, observation must be made on a more concentrated blood solution, approximately 0.1 cm3 of blood in 0.5 cm3 H2O. With such a dilution, a characteristic absorption band for methemoglobin will appear in the red part of the spectrum with λ =630-620 mμ. When diluted with water, two more bands will appear in the yellow-green and green parts of the spectrum, coinciding with the bands of oxyhemoglobin, and finally a fourth band, characteristic of methemoglobin, lies between 518-486 mμ. This band is barely noticeable, and therefore the presence of methemoglobin in the blood can be established, as has been said, by the presence of a band in the "red part of the spectrum." In case of poisoning with hydrogen arsenide, as well as in other diseases, hemolysis of red blood corpuscles may occur in the blood, and with hemolysis, the breakdown of the pigment into globin and hemochromogen; but since there is a large excess of O2 in the blood plasma, hemochromogen is in an oxidized state-in the form of hematine, and when examining this pigment in a spectroscope, we will find a band in the red light with λ =640-630 mμ. Absorption bands will also be present in the yellow-green and green areas, but the characteristic band is in the red light. When (NH4)2S is added, hematine is restored and turns into hemochromogen with two absorption bands I λ=565-554 and II λ=536-523 mμ. In case the band in the red light is due to the presence of methemoglobin, then upon restoration with (NH4)2S, an Hb spectrum with 1 broad band λ =596-543 mμ will be obtained, and not hemochromogen with 2 bands. Among the pigments easily recognizable in a spectroscope, urobilin and porphyrin should also be mentioned. The latter occurs in small amounts in the urine of healthy people, but in certain diseases the amount of this pigment can be significantly increased. Porphyrin is characterized by a spectrum with bands I λ =597-587 mμ, II λ-- a shadow around 576-565 and III λ = 557 - 541 mμ. It can be obtained from urine in lead poisoning by the method of Herrod, precipitating from 200 cm3 of urine 40 cm3 of 10% NaOH (porphyrin is carried down by the precipitating phosphates). The washed precipitate is then dissolved in 0.5-1.0 cm3 of 25% HCl, and the absorption spectrum is examined in a spectroscope. In case of poisoning with sulfonal, in congenital porphyrinuria, porphyrin appears in the urine, which by spectrum is very similar but by chemical properties is different from porphyrin-so-called uroporphyrin. Urobilin, which occurs in urine in certain diseases, is characterized by a spectrum with a broad absorption band λ = 510 - 490 mμ. For such an analysis, a pocket spectroscope is very convenient (see Spectroscopy, spectroscope).
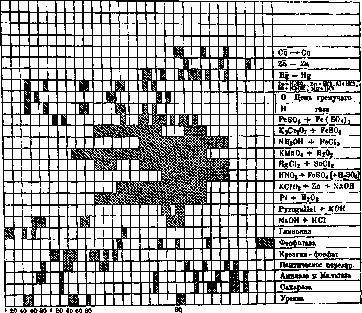
K. Lavrovsky. Biological spectral analysis--an extremely interesting and important new method for studying the fine metabolism of tissues and cells, proceeding without disruption of their structure. The application of biological spectral analysis became possible thanks to the discovery of mitogenetic rays (see). It has been established that the various chemical processes underlying the origin of these rays differ qualitatively from one another by the set of wavelengths (lines) inherent to them. Thus, for each chemical radiation source there is its characteristic spectrum. When studying a source of mitogenetic radiation, it is currently necessary to know its spectrum. By comparing the obtained pattern with already studied templates of the main radiation sources (glycolysis, proteolysis, cleavage of phosphoric acid, etc.), it is possible in each specific case to determine the nature of the processes underlying this radiation. Complex physiological radiation sources turned out to contain essentially a whole set of simple chemical processes--glycolytic, proteolytic, etc. It was later found that fluctuations in spectral patterns are extremely subtle and allow for conclusions whose significance extends far beyond the problem of mitogenesis, being of substantial importance for physiology, chemistry, and other disciplines. Thus, by the method of spectral analysis, fine differences were established in the chemistry of nerve excitation caused by various stimuli--thermal, mechanical, etc.; a completely unique spectrum is obtained in the case of physiological excitation. The nature of metabolism differs spectrally at the site of irritation from the site of conduction, etc. Some data from spectral analysis are of interest in solving a number of questions in biological and general chemistry. Of particular interest is the circumstance that the so-called secondary radiation (see Mitogenetic rays) is resonant, i.e., it responds spectrally to the spectrum of primary irradiation; it is very important to note that under monochromatic exposure, a single line of this spectrum is sufficient to cause the entire spectrum secondarily. This phenomenon, the study of which has only just begun, is of high theoretical interest. The technique of the experiment itself is extremely simple and amounts to placing the radiation source under investigation in front of the entrance slit of a quartz spectrograph, at the exit plane of which, at positions corresponding to different wavelengths and marked by a special scale, is placed a radiation detector--a liquid or solid yeast culture. Based on the presence or absence of effect in one detector or another, one can judge the presence of various spectral lines. By comparison with the simplest chemical sources, the content of this spectrum is determined. This method, which allows the spectral content of a source to be studied with an accuracy of 10 Å, can be significantly refined when working with a monochromator movable slit equipped with a scale and allowing sections 1-3 Å wide to be cut across the entire length of the spectrum. This same method makes it possible to revise the initial crude spectrum. It turns out that in many broad lines, the mitogenetically active part is a strip several Å wide, while the remaining parts (bands) are mitogenetically empty. To obtain general preliminary results, templates are used--the placement of the detector only at a few points in the spectrum corresponding to the main chemical processes. The main radiation sources studied spectrally (see figure): 1) Glycolysis--the best studied sources of it are: a) lactic acid fermentation, b) hemolyzed blood with added glucose, c) alcoholic fermentation, etc. The coincidence of the spectra of these chemically very different processes indicates that glycolytic radiation is connected with the first stage of the process--the breakdown of the glucose molecule into its two constituent trioses; only in this initial stage does the chemistry of such processes as, for example, lactic acid and alcoholic (yeast) fermentation coincide; the further course of glycolysis varies in different cases. The most characteristic lines for glycolysis are: 1,900-20 Å, 1,940-50 Å, 1,960-70 Å, 2,170-80 Å. 2) Proteolytic spectrum--an example is the digestion of fibrin or serum-albumin by gastric juice and of dipeptides (glycyl-glycine) by erepsin. The coincidence in the spectra of these two processes leads one to associate the radiation with the common moment for them of the removal of the NH2 group. The most characteristic lines are: 1,980-90 Å, 2,030-50 Å, 2,110-30 Å, 2,300-10 Å, 2,340-50 Å, 2,390-2,400 Å, 2,410-20 Å. 3) Phosphatase spectrum--as the object, the action of phosphatase on lecithin and nucleic acid was investigated. The most characteristic lines studied on the phosphatase of cancer cells are: 2,150-60 Å, 2,240-50 Å, 2,280-90 Å, 2,350-60 Å, 2,460-80 Å, 2,480-2,500 Å--the longest of the mitogenetic radiation lines known to us so far. The action of liver phosphatase shows new lines: 1,980-90 Å, 1,990-2,000 Å. 4) Spectrum of the breakdown of di- and polysaccharides--as objects, maltose and sucrose were used; according to the difference in their chemical structure, differences were also obtained in the spectral pattern. These differences make it possible to approach the question of the structure of the polysaccharide (starch); the coincidence of its spectrum with that of maltose allows one to assert that it is a polymer of the latter. The lines characteristic of maltose are 1,970-80 Å, 1,980-90 Å, 2,020-30 Å, 2,230-40 Å, 2,320-30 Å, 2,370-80 Å, 2,400-10 Å, 2,410-20 Å, 2,430-40 Å; for sucrose, the absence of the first two lines is characteristic. 5) Spectrum of the breakdown of creatine-phosphoric acid is found in a number of physiological radiation sources--in muscles, nerve, circulating blood, etc., and is characterized by lines 2,000-20 Å, 2,030-60 Å, 2,090-2,110 Å, etc. 6) Spectrum of the action of the enzyme urease (causing the breakdown of urea) coincides with the absorption and destruction spectra of this substance; the most characteristic lines are 1,940-50 Å, 1,950-60 Å, 2,040-50 Å, 2,050-60 Å, 2,080-90 Å, 2,290-2,300 Å. 7) Spectrum of oxidative processes was studied on the oxidation of pyrogallic acid in an alkaline medium, on the oxidation of glucose by permanganate and of blood serum by hydrogen peroxide, and especially on inorganic oxidative models, e.g., K2Cr2O7+FeSO4, HgCl2+SnCl2, etc. (Braunstein and Pototskaya). In all these cases, oxidative processes are understood in the broadest sense as processes of exchange of electrons between two chemical systems (oxidation-reduction processes); special experiments show that the moment of radiation is connected with the process of attachment of electrons to the system, i.e., with reduction. The spectra of various oxidation reactions are very similar but not identical; characteristic lines are in the middle part of the spectrum; for oxidation by pyrogallic acid, for example, the lines 2,250-70 Å, 2,280-2,300 Å are typical. A number of lines found in some physiological radiation sources cannot yet be chemically identified at present. s. Zapkind.
A B E b F 500 450 ' Oxyhemoglobin Hemoglobin Methemoglobin (neutral pH) Hematin acid pH Hematin alkaline pH Carboxyhemoglobin Hemochromogen Hematoporphyrin VISL, pH- Hematoporphyrin (alkaline pH) Urobilin ammoniacal pH + Zn++ Chlorophyll
D
Kb
F
represents a revision of the initial crude spectrum. It turns out that in many broad lines, the mitogenetically active part is a strip several Å wide, while the remaining parts (bands) are mitogenetically empty. To obtain general preliminary results, templates are used--the placement of the detector only at a few points in the spectrum corresponding to the main chemical processes. The main radiation sources studied spectrally (see figure): 1) Glycolysis--the best studied sources of it are: a) lactic acid fermentation, b) hemolyzed blood with added glucose, c) alcoholic fermentation, etc. The coincidence of the spectra of these chemically very different processes indicates that glycolytic radiation is connected with the first stage of the process--the breakdown of the glucose molecule into its two constituent trioses; only in this initial stage does the chemistry of such processes as, for example, lactic acid and alcoholic (yeast) fermentation coincide; the further course of glycolysis varies in different cases. The most characteristic lines for glycolysis are: 1,900-20 Å, 1,940-50 Å, 1,960-70 Å, 2,170-80 Å. 2) Proteolytic spectrum--an example is the digestion of fibrin or serum-albumin by gastric juice and of dipeptides (glycyl-glycine) by erepsin. The coincidence in the spectra of these two processes leads one to associate the radiation with the common moment for them of the removal of the NH2 group. The most characteristic lines are: 1,980-90 Å, 2,030-50 Å, 2,110-30 Å, 2,300-10 Å, 2,340-50 Å, 2,390-2,400 Å, 2,410-20 Å. 3) Phosphatase spectrum--as the object, the action of phosphatase on lecithin and nucleic acid was investigated. The most characteristic lines studied on the phosphatase of cancer cells are: 2,150-60 Å, 2,240-50 Å, 2,280-90 Å, 2,350-60 Å, 2,460-80 Å, 2,480-2,500 Å--the longest of the mitogenetic radiation lines known to us so far. The action of liver phosphatase shows new lines: 1,980-90 Å, 1,990-2,000 Å. 4) Spectrum of the breakdown of di- and polysaccharides--as objects, maltose and sucrose were used; according to the difference in their chemical structure, differences were also obtained in the spectral pattern. These differences make it possible to approach the question of the structure of the polysaccharide (starch); the coincidence of its spectrum with that of maltose allows one to assert that it is a polymer of the latter. The lines characteristic of maltose are 1,970-80 Å, 1,980-90 Å, 2,020-30 Å, 2,230-40 Å, 2,320-30 Å, 2,370-80 Å, 2,400-10 Å, 2,410-20 Å, 2,430-40 Å; for sucrose, the absence of the first two lines is characteristic. 5) Spectrum of the breakdown of creatine-phosphoric acid is found in a number of physiological radiation sources--in muscles, nerve, circulating blood, etc., and is characterized by lines 2,000-20 Å, 2,030-60 Å, 2,090-2,110 Å, etc. 6) Spectrum of the action of the enzyme urease (causing the breakdown of urea) coincides with the absorption and destruction spectra of this substance; the most characteristic lines are 1,940-50 Å, 1,950-60 Å, 2,040-50 Å, 2,050-60 Å, 2,080-90 Å, 2,290-2,300 Å. 7) Spectrum of oxidative processes was studied on the oxidation of pyrogallic acid in an alkaline medium, on the oxidation of glucose by permanganate and of blood serum by hydrogen peroxide, and especially on inorganic oxidative models, e.g., K2Cr2O7+FeSO4, HgCl2+SnCl2, etc. (Braunstein and Pototskaya). In all these cases, oxidative processes are understood in the broadest sense as processes of exchange of electrons between two chemical systems (oxidation-reduction processes); special experiments show that the moment of radiation is connected with the process of attachment of electrons to the system, i.e., with reduction. The spectra of various oxidation reactions are very similar but not identical; characteristic lines are in the middle part of the spectrum; for oxidation by pyrogallic acid, for example, the lines 2,250-70 Å, 2,280-2,300 Å are typical. A number of lines found in some physiological radiation sources cannot yet be chemically identified at present. s. Zapkind.
2,000
2,500 6) Spectrum of the action of the enzyme urease (causing the breakdown of urea) coincides with the absorption and destruction spectra of this substance; the most characteristic lines are 1,940-50 Å, 1,950-60 Å, 2,040-50 Å, 2,050-60 Å, 2,080-90 Å, 2,290-2,300 Å. 7) Spectrum of oxidative processes was studied on the oxidation of pyrogallic acid in an alkaline medium, on the oxidation of glucose by permanganate and of blood serum by hydrogen peroxide, and especially on inorganic oxidative models, e.g., K2Cr2O7+FeSO4, HgCl2+SnCl2, etc. (Braunstein and Pototskaya). In all these cases, oxidative processes are understood in the broadest sense as processes of exchange of electrons between two chemical systems (oxidation-reduction processes); special experiments show that the moment of radiation is connected with the process of attachment of electrons to the system, i.e., with reduction. The spectra of various oxidation reactions are very similar but not identical; characteristic lines are in the middle part of the spectrum; for oxidation by pyrogallic acid, for example, the lines 2,250-70 Å, 2,280-2,300 Å are typical. A number of lines found in some physiological radiation sources cannot yet be chemically identified at present. s. Zapkind.
Diagram of spectra of mitogenetic radiation from various chemical sources.
2*00
2500 6) Spectrum of the action of the enzyme urease (causing the breakdown of urea) coincides with the absorption and destruction spectra of this substance; the most characteristic lines are 1,940-50 Å, 1,950-60 Å, 2,040-50 Å, 2,050-60 Å, 2,080-90 Å, 2,290-2,300 Å. 7) Spectrum of oxidative processes was studied on the oxidation of pyrogallic acid in an alkaline medium, on the oxidation of glucose by permanganate and of blood serum by hydrogen peroxide, and especially on inorganic oxidative models, e.g., K2Cr2O7+FeSO4, HgCl2+SnCl2, etc. (Braunstein and Pototskaya). In all these cases, oxidative processes are understood in the broadest sense as processes of exchange of electrons between two chemical systems (oxidation-reduction processes); special experiments show that the moment of radiation is connected with the process of attachment of electrons to the system, i.e., with reduction. The spectra of various oxidation reactions are very similar but not identical; characteristic lines are in the middle part of the spectrum; for oxidation by pyrogallic acid, for example, the lines 2,250-70 Å, 2,280-2,300 Å are typical. A number of lines found in some physiological radiation sources cannot yet be chemically identified at present. s. Zapkind.
Related articles
Mentioned in
Cite this page
“Spectral Analysis.” Soviet Medical Encyclopedia. English translation of Bolshaya Meditsinskaya Entsiklopediya, 1st ed. (Moscow, 1928–1936), ed. N. A. Semashko. https://sovietmedicalencyclopedia.pages.dev/article/spectral-analysis/