Vershino-Chika Springs
Historical document, translated for reference. It reflects medical knowledge of the 1920s–30s and is not medical advice.
Summary
A historical encyclopedia entry on the Vershino-Chika Springs, noting their relation to Transbaikal resorts, followed by a detailed discussion of weight (absolute, apothecary, atomic, molecular, and constant), body weight in relation to physical development, and the weight of the child.
Encyclopedia article (1928–1936)
VERSHINO-CHIKA SPRINGS, see Transbaikal resorts. WEIGHT.—Absolute weight is the force with which the earth attracts a given body. Since weight is proportional to mass, for convenience it can be measured in the same units in which mass is measured, i.e., in grams.

A small turbine driven by a clockwork mechanism M; a is the winding key, b is the brake, the release of which causes the disk e to rotate.
in which mass is measured, i.e., in grams. Since at various points of the earth's surface one and the same mass is attracted to the center of the earth with varying force, it is obvious that the body weight is not a constant value, but depends on the location of the point at which it is determined. Usually, the weight of bodies is determined in the air. But, according to Archimedes' principle, every body must thereby lose in its weight as much as the air displaced by it weighs. To determine the true absolute weight, it is necessary to introduce a number of corrections into the weight determined by weighing—for height above sea level, geographic latitude, for the loss in weight of the weighed body and weights, etc. V. Shuleshkin. Apothecary weight. Before the introduction of the metric system, medical weight everywhere differed from commercial ("civil") weight. The peculiar apothecary weight penetrated into Europe in the 11th century with the assistance of the Arabs, retaining its special signs and divisions: Libra (℔), Unzia (℥), Drachma (ʒ), Scrupulum (℈), and Granum (gr.)—names of Egyptian, Jewish, and Greek origin. The apothecary weight, formerly adopted in Nuremberg and becoming legal for some states, was most widely used; therefore, the name apothecary or medical weight is often replaced by the name "Nuremberg weight." The latter is divided as follows: 1 apothecary pound
(℔ - Libra)
(gr. - Granum)......... To designate quantities, Roman numerals are written after the weight sign (instead of 1—j); e.g., 2 ounces are depicted as ℥jj, 5 grains as gr. V, etc. To designate a half (semis), the letter s is written after the weight sign. For example, ʒs = 1/2 drachm. However, the desire to bring the apothecary weight into a certain definite relation with the commercial weight (usually the apothecary weight constituted approximately 3/4 of the commercial one) caused this apothecary weight to turn out unequal in many countries. Conversion of apothecary units in various countries into grams: In Prussia... 1 apothecary pound = 350.784 g, Bavaria (Nuremberg), Russia, Denmark, Hamburg... 357.964 g, Austria... 420.828 g, Sweden... 356.370 g, England and U.S.A.... 372.931 g. This clearly inconvenient empirical weight was replaced in France in 1786 by the gram decimal weight. The latter, thanks to its rationality, has now almost everywhere ousted the former apothecary weight from medical use. In Germany, the gram weight was introduced in 1868, in Russia—from September 1899. Only in England and the U.S.A., along with the gram weight, is the apothecary weight still quite widely used. When converting apothecary weight ("Nuremberg") into grams, the latter, as officially established, is shown in the following round figures: 1 apothecary pound = 360.0 g, 1 ounce = 30.0 g, 1 drachm = 3.75 g, 1 scruple = 1.25 g, 1 grain = 0.06 g. L. Yarkho. Atomic weight, see Atomic weight.—Molecular weight, see Molecular weight. Constant weight, a state of substance in which the further continuation of the operation performed on it no longer causes changes in its weight. The acquisition of a constant weight in a number of cases serves as a characteristic sign that the operation performed on it is completed; for example, the ignition of precipitates in gravimetric analysis (see) is completed only when, by repeated ignition and weighing, one is convinced of the constancy of the weight of the precipitate; in the same way, the drying of a substance, the saturation of liquids with gases, and similar operations are conducted.—Specific gravity, see Specific gravity. BODY WEIGHT, an important indicator of physical development, depending on a number of congenital and acquired morphological and biochemical properties of the organism (body length, skeletal mass, thickness of the fat layer, amount and consistency of musculature, etc.). Characterizing, in the absence of pathological deviations, at identical body length and proportions, predominantly the nutritional state of the organism, body weight reflects the influence of the environment on the organism more sensitively than other basic measuring features (height, chest circumference) and gives large fluctuations over time, by virtue of which the characterization of body weight is one of the main elements of statistics on the physical condition of the population. In the period from 7 to 14 years, the weight gain is quite variable, from 2 to 31/2 kg per year on average; in the prepubertal period, girls catch up with boys, and at 13–14 years they are already noticeably heavier than the latter. At 15–17 years (the pubertal period of boys), the weight gain averages 4–41/2 kg per year in boys and 31/2–4 kg in girls. Roughly from 16 years of age, boys again overtake girls in weight, and further this difference steadily increases in favor of males. After puberty, the weight increase averages 1–11/2 kg per year; at the age of 20–25 years—about 3/4 kg, at the age of 25–30 years—1/2 kg. After 50–55 years, a drop in weight is observed, reaching 5 kg or more in old age. The extreme limits of non-pathological body weight for an adult male can be considered 48–85 kg, for an adult female—35–75 kg. Average figures fluctuate within 55–75 kg for men and 45–65 kg for women. It is necessary to take into account, of course, body length. The weight of individual body systems (according to Vierordt) is (as a percentage of total body weight): (℥jj) = 357 (℥VIII) (gr.XX) - 964 g 29.861 » 3.75 » 1.25 » 0.0625 » Body tissue systems Male Skeleton......... Muscles....... Skin with appendages . Fatty tissue . Viscera . . . . 18 42 6 12 22 Female In the newborn, the ratio between muscles and viscera is inverse. The ratio of the weight of individual parts can vary significantly. Thus, the relative weight of fat in men can range from 9 to 15% of total weight. Individual groups give such significant deviations in body weight that data on an individual's body weight can only be taken into account in comparison with average data relating to a certain group (socio-economic, ethnic, age, sex) of a certain historical period. Thus, in modern German children, according to Schlesinger: Body weight in kg Body weight in kg Age in low-income families well-to-do families Age in low-income families well-to-do families 6 years 18.8 20.9 12 years 32.2 34.7 7 » 20.6 22.3 13 » 33.8 38.8 8 » 23.1 24.5 14 » 38.8 42.5 9 » 24.6 27.6 15 » 43.5 49.0 10 » 27.1 28.9 16 » 48.6 54.7 11 » 28.2 31.5 Average weight of German recruits according to Meinshausen: Profession Body weight in kg Butchers............... 64.8 Shopkeepers, fishermen........ 63.8 Masons............. 63.1 Analogous differences are revealed by measurements of various social groups in the USSR. Fluctuations caused by changes in historical conditions are no less significant. Thus, the average body weight of working adolescent boys (in kg): Age 1880 (according to Erisman) 1923 (according to Kurkin) 14 years .... 15 » .... 16 » .... 17 » .... 18 » .... 35.2 39.4 41.0 49.8 53.9 40.5 43.1 48.1 54.6 56.2 Sharp social shocks (war, famine) are reflected in the average body weight quite noticeably. Under the influence of the hunger blockade of Germany, the average body weight of school-age children in Leipzig decreased by 1918–19 by 4 kg, i.e., by 12%, compared to pre-war averages. Prolonged malnutrition in 1918–21 and acute starvation in 1921–22 in the USSR (according to Ivanovsky, Nikolayev, Shtefko) gave a sharp drop in body weight, reaching up to 40%; especially sharply the weight of viscera and endocrine glands decreased. With the end of the period of war and famine, body weight began to recover rapidly. Since it is obvious that weight can be characterized only in comparison with height, a number of formulas have been proposed in which body weight is reduced to the same height by dividing by height to the 1st, 2nd, and 3rd power. At present, the method of regression scales is increasingly used (see Physical development indices). Sharp changes in weight are typical for a number of pathological cases. These include sharp decreases in weight in a number of severe acute and chronic diseases. Conversely, sharp increases in weight are associated with some disorders, e.g., dropsy, obesity, myxedema.
L. Syrkin. Child's weight—the most important measure of development. Data on the weight of the human fetus are scarce and inaccurate; according to Karnitsky, the weight of the fetus at 11/2 months is 3.15 g, at 2 months—9.45 g, at 3 months—28.7 g, at 4 months—56.7 g, at 5 months—226 g, at 6 months—666 g, at 7 months—1,169 g, at 8 months—1,588 g, at 9 months—2,495 g. The growth tendency is thus expressed very sharply. The weight of a healthy and full-term newborn child fluctuates within significant limits; according to Gundobin, from 2,600
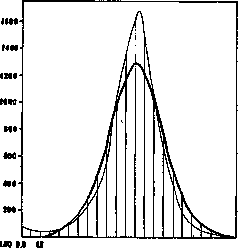
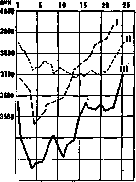
Diag. 1. up to 4,300 g, according to Cammerer from 2,800 to 4,500 g; the latest Moscow data determine the limits of normal fluctuations to be 2,500-4,000 g. However, deviations in one direction or another are not uncommon. The greater the deviation 755 from the most frequently encountered average figures, the rarer it occurs (see diag. 1—the theoretical variation curve and the actual curve). The greatest number of children (56%) are born with a weight from 3,000 to 3,800 g (Speransky's data for 1910-13); the frequency of these figures by 1923-1924 increased, according to Dulitsky, by 4.74%, which, in his opinion, indicates an improvement in the organization of mother and infant welfare work. The data of various authors on the average weight of a newborn child are given in the following table: Authors Boys Girls 3,250 3,410 3,489 3,000 3,397 3,333 3,000 3,200 3,250 3,522 3,500 3,400 3,500 3,680 3,200 Dulitsky .......... Thus, newborn boys weigh somewhat more than girls. Children with a weight below 2,500 g are usually classified as weakly born (premature birth, other factors), children above 4,000 g as giants; such a division, however, is very conditional, and by no means every child with a small weight will be a debilic or premature infant. Weight above 4,000 g, according to Speransky's observations, is encountered more often in boys. In the first days after birth, the child's weight drops (the "physiological" drop). The magnitude of the drop is subject to individual fluctuations, averaging 100-300 g (Jaschke, Reuss), but in individual cases reaches 500 g and more. Dulitsky, on a very large amount of material, gives an average figure of 193 g, and Antonov—247 g. Jaschke found that for children below 2,000 g, the weight drop is 8.5% of the initial weight, and for children above 2,500—6.5%; but sometimes a figure of 10% can also be considered normal. Antonov's average figure is 7.5% of the initial weight. Pfaundler believes that the weight loss is proportional not to the weight, but to the body surface area of the newborn; therefore, the smaller the child weighs, the greater the loss. Girls, apparently, lose more than boys (Maslov), and children of primiparae—more than of multiparae (Pies). The causes of the physiological weight drop in newborns are complex and not yet fully studied; the major part of the weight loss (65-70%) is apparently due to water loss (perspiratio insensibilis), whereas losses due to excretions (urine, meconium, vomit), contrary to former opinion, should be ascribed only an insignificant role. By abundant fluid administration in the first twenty-four hours after birth, American authors succeeded in reducing weight loss. Weight loss to a certain extent also occurs at the expense of body fat and protein due to insufficient food intake in the first days (starvation); at least, by early applying to the breast (Kononova) or concentrated supplementary feeding (Schick), it was possible to reduce or bring to zero the weight loss. However, as Pfaundler justly remarks, if weight drop can be masked by supplementary feeding, this still tells us nothing about the causes of the drop. After the cessation of the weight drop, its curve begins to rise, and depending on the individuality of the child, the rise in some cases occurs so rapidly that by the 10th-12th day the weight already reaches the initial figure (Budin type curve), while in other, more frequent cases (according to Antonov—in 74%), the weight drops much slower and reaches the initial figure only by the end of the 3rd or 4th week (Pies type I curve). In some cases, however, the weight, having given a slight rise after the initial drop, drops again, after which it begins to increase (Pies type II curve): according to Pfaundler, this type belongs to pathology (undernutrition). In children of multiparous mothers, the weight, in general, levels off more quickly (see diag. 2). The smaller the child, the more pronounced is his tendency to mass increase. Thus, during the first month of life, a child gains, on average, 700-800 g, which amounts to about 25 g per day; in subsequent months, the weight gains decrease by approximately 50 g, so that, for example, in the 3rd month the child gains 600- Diag. 2. I—Budin's type; 700 g, in the 6th mo.— II—Pies' type I; III— 450-550 g, etc.
Pies' type II. Often, however, such a strict regularity does not exist, and the child gains less than normal in the first months, and in the following
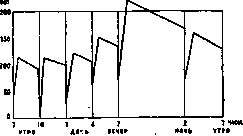
Diag. 3 (according to Schlesinger).
more than normal, and vice versa. Such an increase in weight by "leaps" in a healthy child is most clearly visible with frequent weighing, daily or weekly; even during the day, weight increases (at night) and decreases (towards morning; see diagr. 3) are observed. Thus, the true weight curve represents not a parabola, as it is usually depicted, but a zigzag line. The weight of a healthy child doubles by 5 months, and triples by one year. Children with a low initial weight usually double their weight earlier. After one year, the weight increase slows down. During the entire second year, the weight increases, on average, by 2,500 g (Gundobin), i.e., approximately by 200 g per month. During the third year and subsequent years, the weight increases by 1,500-2,000 g, so that by 6-7 years of age the weight of a one-year-old child triples. From the age of 7, an accelerated increase in weight begins: from 7 to 10 years, on average, by 2,000 g per year, from 10 to 11 years—by 2,500 g, from 12 to 14 years—by 3,000-4,000 g per year. Thus, the child's weight curve presents two maxima: the 1st year of life and the period of puberty. The weight of girls, lagging behind the weight of boys in the first years of life, outpaces it in the period from 6 to 13 years, and then begins to lag behind again (see diagr. 4). The approximate weight of a child of any age can be determined by multiplying 2 kg by the number of years + the weight of a one-year-old child. The child's weight is under the influence of the most diverse causes. Already in the newborn, one can note the influence of heredity (height of parents), duration of pregnancy, number of births, age and health of parents. A very large influence on the weight of the newborn is also exerted by the social conditions of the parents, especially the mother, her profession (occupational hazards) and the time she stopped working before childbirth—long before (2 months) childbirth or immediately before childbirth. The bad influence of unfavorable social conditions affects the whole childhood. This can be seen from the following table (Schlesinger), elucidating the influence of material security on the weight of a schoolchild (Germany): Age Weight (average figures) 6 years 7 » 8 » 9 » 10 » 11 » 12 » 13 » 14 » Secure Insecure 20.9 kg 1 18.6 kg 22.3 » 1 20.6 » 24.5 » 1 23.1 » 27.6 » 27.6 » 28.9 » 27.1 » 31.5 » 28.2 » 34.7 » 32.2 » 38.8 » 1 33.8 » 42.5 » 38.8 » Here we should also mention the poor increase in the weight curve in children raised in conditions of a closed institution ("hospitalism"). Maternal nutrition (resp. starvation), apparently, does not have a particularly noticeable effect on the weight of the newborn, at least according to German data (Czerny, Maron); the starvation of the child itself, of course, sharply affects the weight: thus, Shtefko found that the child population of the Volga provinces in famine years reached the tripled weight of a one-year-old child not by 6-7 years, as is normal, but 3-4 years later. Schlesinger notes a sharp drop in weight (by 24-28%) of schoolchildren in Vilna in 1919 compared to 1912. In general, all feeding irregularities are capable of influencing weight, especially in early childhood. The same must be said about artificial, even if rational, feeding in infancy. National differences further affect the weight of the newborn: thus, the weight curve of a French child (Marfan) is lower than the Russian curves; these, in turn, are lower than the weight curve of a German, Georgian (Gundobin), Norwegian, American child (Czerny). Even in different cities, the weight curve can be different: thus, for example, the weight curve of an Odessa child (Ruban) is higher than the Moscow curve (Dulitsky and Moshkevich). According to Dulitsky's observations, the season of the year also plays a role. Children with the highest average weight are born in the period from August 15 to November 15, and with the lowest—from November 15 to February 15. The following table shows how the work of a schoolchild affects weight (Schlesinger): Weight of healthy schoolchildren before the spring holidays (comparison of weight figures from the beginning of July with figures from the beginning of April). Years 1906-09. 1911. 1916-17. (war) Weight loss (in %) ±0.3 kg Weight gain (in %) 0.4-0.9 kg 1 kg and more 0.4-0.9 kg 1 kg and more 17.1 24.7 29 2.6 5.1 20 28.8 34.2 25.9 15 17.4 3.5 5 All these data show that when judging the "normal" weight of each child, it is necessary to reckon not with the average weight of a child of a given age, but with the average weight of a child of a homogeneous group with him, taking into account all factors upon which weight in a given case may depend. At the same time, it should be emphasized that weight, especially at an early age, is an extremely sensitive reagent to all sorts of changes in the organism and in the environment. In the first months of life, even the most insignificant, sometimes simply indefinite causes are capable of influencing weight in the sense of its decrease (physiological hydrolability). With some constitutional anomalies (exudative diathesis, lymphatism) and with diseases, this hydrolability can affect weight especially sharply. Children with exudative diathesis, for example, often for a very long time do not show weight increases, despite sufficient feeding and other favorable conditions, and sometimes, on the contrary, show excessive gains. Prematurity usually sharply affects the child's weight; even with an extremely intensive increase in weight, it usually catches up with the norm only by the 5th year of life (Schreib). In the same way, all diseases of the child—acute and chronic, congenital and acquired—often unfavorably affect the weight curve. Upon the child's recovery, the weight curve usually begins to rise steeply upward, and weight gains here can far surpass the norm. Thus, by the course of the weight curve, one can easily monitor the development of the child, especially at an early age; if the weight increases well, then even significantly expressed painful phenomena may not arouse special fears, and, conversely, a sharp drop in weight even with insignificant symptoms of disease is a bad sign. However, the increase in weight is not always a favorable sign: it may be the first sign of pathological water retention in the body, a sign of edema not yet clinically manifested, the so-called Praedem (for example, in cardiac decompensation, nephritis, certain nutritional disorders in infants, etc.).
A. Sokolov. Body weight of the mentally ill, being a very sensitive indicator of the state of nutrition of the organism and the general direction of metabolic processes in it, always has essential significance for the clinical evaluation and prognosis of individual cases. If body weight during different periods of the disease is represented as a curve, then, as a general rule, acute periods of the disease are accompanied by a drop in the curve, replaced by a rise upon the subsiding of the process or recovery. Often the cessation of weight drop is the earliest clinical sign of beginning improvement. In some cases, however, the replacement of weight drop by a rise also has an unfavorable prognostic significance, if it is not followed by an improvement in the mental state, but, as sometimes happens, signs of mental disintegration begin to appear more distinctly. In such cases (most often these are attacks of schizophrenia), it is mostly a matter of the transition of the pathological process from the acute period to the chronic one, and thus, the possibility of recovery or even a significant remission is excluded. In acute psychoses, a continuously progressive drop in the patient's body weight, despite forced feeding, has a very bad prognostic significance, sometimes being a harbinger of a fatal outcome. A steady drop in weight is also given by the terminal states of organic psychoses accompanied by marasmus (progressive paralysis, senile dementia, etc.).
Related articles
Cite this page
“Vershino-Chika Springs.” Soviet Medical Encyclopedia. English translation of Bolshaya Meditsinskaya Entsiklopediya, 1st ed. (Moscow, 1928–1936), ed. N. A. Semashko. https://sovietmedicalencyclopedia.pages.dev/article/vershino-chika-springs/