Application of Rectangular and Sector Diagrams
Historical document, translated for reference. It reflects medical knowledge of the 1920s–30s and is not medical advice.
Summary
This article explains the use of rectangular and sector diagrams for comparing parts of a whole and displaying both absolute and relative values simultaneously. It also discusses various types of statistical diagrams including bilateral, spatial, and cartograms, along with their applications in medical and demographic statistics.
Encyclopedia article (1928–1936)
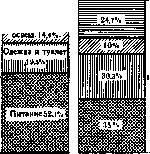
Application of rectangular (A) and sector (B) diagrams for depicting and comparing the relative magnitude of individual constituent parts of a whole. Other 14% = Housing, heating.
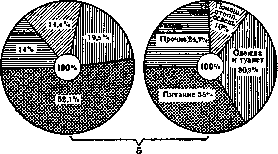
Application of rectangular (C) and sector (D) diagrams for depicting and comparing simultaneously both absolute and relative magnitudes.
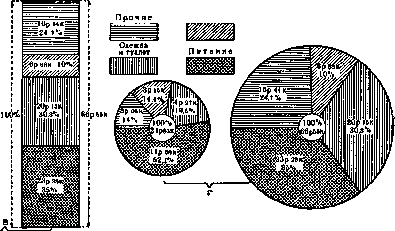
Figure 2. Structure of the expenditure budget of workers in the USSR - with different budget sizes - (1925)

ILLITERATE. Fig. 2. Literacy of the population of Russia and the USSR by age and sex [according to census data of 1897, 1920]
[According to A.D. Demkan 1 Education and duaz.paMMj Table IV. Average medical district in the provinces of European Russia before the World War (1913)
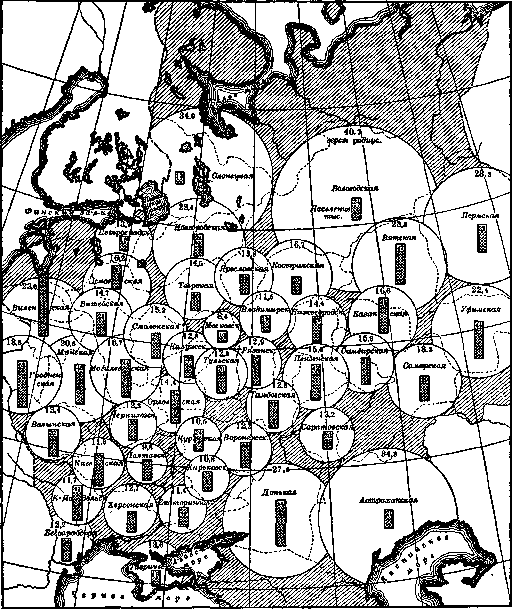
Average radius (in versts) Population of the medical district (in thousands) According to P.I. Kurkin Sanitary-statistical tables." to reveal the internal structure of phenomena and changes in it. Plane diagrams are suitable for depicting phenomena relating to isolated periods of time, whereas the idea of continuous changes over time is better expressed by a linear curve diagram. A special type of plane diagrams are bilateral, or pyramidal diagrams, the idea of which is quite clear from the accompanying figures (Table III, as well as diagrams on p. 185, vol. IV - "Typhoid fever morbidity by age and sex"). They are usually used in cases where it is desirable to depict two such series of phenomena which essentially represent as it were two sides of one broader phenomenon, e.g. birth rate and death rate among men and women - two constituent parts of the general birth rate or general death rate of the population, etc. Thus, for example, the bilateral diagram of the age structure of the population depicted in Fig. 1, Table III, clearly reveals the damage in the male part of the population of conscription age (and in the age group up to 5 years and for both sexes), which resulted from the imperialist and civil wars. The complex bilateral diagram depicted in Fig. 2, Table III, allows to simultaneously show both the difference in literacy of the male and female parts of the population and the changes in the state of literacy that occurred from 1897 to 1920 in each of these population groups. Spatial diagrams (stereograms), in the construction of which use is made of images having three dimensions (cubes, pyramids, spheres), are used mainly for popularizing statistical conclusions. Particularly widespread in the matter of popularization have become the so-called illustrated diagrams, in which the magnitudes of various phenomena are depicted by conventional figures (symbols), human figures, coffins, crosses, etc. The most frequent error encountered in compiling such diagrams is that different magnitudes of phenomena are depicted by different sizes of objects; meanwhile, the depiction of an object having a complex shape is not easily susceptible to correct measurement. Therefore, if necessary, for the purpose of popularization, to resort to the construction of illustrated diagrams, different magnitudes of phenomena should be depicted not by different sizes of various figures, but by their different quantity. Along with diagrams in the proper sense of this word, for the graphical representation of numerical magnitudes and phenomena varying by territory, so-called cartograms are used. Cartograms are graphical representations consisting in the plotting of numerical data on a geographical map. A cartogram gives the topographical distribution of statistical conclusions, which a table can never give a sufficient representation of. This is the advantage of cartograms over diagrams: they not only visually represent numerical data, which diagrams also do, but at the same time show the distribution of these data over specific territories, which facilitates the assimilation of the observed phenomena. The most common type of cartogram is the one where the different magnitude of statistical data is depicted by means of tones of different density, obtained by hatching or coloring. The hatching method has the advantage of being cheaper and, when satisfactorily executed, can meet the most stringent requirements of clarity: rare and pale hatching itself creates an impression of small, dense - of great intensity of the phenomenon (vol. IV, pp. 179-181 - "Typhoid fever morbidity in the European and Asian parts of the USSR in 1926"). For clarity of cartograms, it is necessary beforehand to divide all the various coefficients calculated for individual territorial units into a small number of groups (from-to), each of which will have its own designation different from the others. Usually, for the sake of clarity, the number of such groups should not exceed five. Cartograms of this type are used when dealing with the change by territory of one phenomenon. In cases where it is necessary to simultaneously depict the change by territory of different phenomena or different functions of one factor, resort is made to the construction of cartodiagrams. A cartodiagram consists of a diagram (bar, circular, etc.) plotted on a map (Table IV). In other cases, facts having statistical significance are depicted on maps by means of conventional signs-hieroglyphs (see vol. IV, pp. 171-172, cartogram "Mortality from typhoid fever in large cities of Europe in 1926"). Technique for preparing diagrams. For drawing diagrams, certain basic instruments are necessary: rulers, triangles, compasses, etc. The use of ready-lined paper (e.g. millimeter paper, etc.) significantly facilitates the work. Inscriptions on diagrams should be clear, with main inscriptions so large that they can be read from the distance from which the diagram is supposed to be viewed; secondary inscriptions and explanatory texts can be depicted in smaller print. The lines depicted on diagrams, expressing one phenomenon or another, should have an explanatory inscription (explication). The heading of a diagram requires careful editing and should, especially in diagrams intended for popularization, indicate its content, the essence of the depicted phenomena and the conclusion (for example "decrease in mortality" and not "mortality", etc.). In a diagram, the time and place to which the statistical data refer, and the source from which the numerical materials were taken, should be indicated. Lit.- see literature for the article Graphical representations.
Related articles
Cite this page
“Application of Rectangular and Sector Diagrams.” Soviet Medical Encyclopedia. English translation of Bolshaya Meditsinskaya Entsiklopediya, 1st ed. (Moscow, 1928–1936), ed. N. A. Semashko. https://sovietmedicalencyclopedia.pages.dev/article/application-of-rectangular-and-sector-diagrams/