Graphical Representations
Historical document, translated for reference. It reflects medical knowledge of the 1920s–30s and is not medical advice.
Summary
Graphical representations are visual tools using lines or figures to illustrate relationships between numerical data or phenomena. They are essential in medical statistics for both scientific analysis and public health education.
Encyclopedia article (1928–1936)
Graphical representations, a means of presentation using drawings—lines or figures—to illustrate the internal relationships between numerical series or between individual phenomena and processes. Graphical representations 'speak directly to the eye, acting on the general impression of the external senses and on the imagination. Instead of reading number by number, we immediately grasp the entire complex of phenomena and immediately capture what they have in common or what is opposite' (Yanson). Thanks to their visual clarity, graphical representations provide significant help in concretizing abstract concepts and facilitate their perception. It is therefore not surprising that 'the method of graphical representations, which for a long time was neglected due to the tyranny of abstract thinking, is now triumphantly marching through all fields of scientific knowledge' (Auerbach).-Graphical representations have enormous significance in medicine. The main purpose of graphical representations is to serve the purposes of scientific analysis of statistical material; secondly, they are the primary method for popularizing statistical information and conclusions concerning health protection issues. The scientific significance of graphical representations lies in the fact that, when methodologically correctly constructed, they: 1. Provide an accurate representation of the relationships between quantities of different numerical series and facilitate determining the trend of these series and the
ooooo
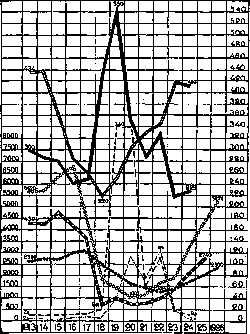
Gross production (in millions of rubles) shaaaFreight turnover (in billion pud-versts) > »
Number of workers (in thousands) ------
) Figure 1. Economic factors of social health. phenomenon of deviations from normal movement, thus serving as an exact control on the correctness of statistical series; 'when numbers are translated into a drawing, their slightest inaccuracies become completely obvious; it remains to be determined whether the inaccuracy lies in the essence of the phenomenon or occurred from an error of observation' (Yanson). 2. Facilitate statistical comparison, revealing in the coexistence of different phenomena such relationships that are difficult to observe with only the reading of numerical tables. 3. Make possible inter- and extrapolation, extending curves beyond the available material, leveling irregular series, and various types of calculations. The collection of various methods of graphical calculations constitutes the subject of a special science—nomography. 4. They are the best material for demonstrating statistical information, arousing interest in statistical observations among non-specialists. Therefore, graphical representations are one of the essential elements of any statistical research. At the moment when the researcher has to move from compiling statistical series to their analysis, graphical representations can be of great help, allowing them more easily to grasp the overall picture of dependencies between numerical series and also to determine the main directions of further, more in-depth analysis. Thus, the data presented in Figure 1 in the form of graphical representations regarding economic factors of social health, in their original form, have the form of numerical series (statistical tables) containing figures about the number of workers employed in industry, about the gross industrial product, about the work of transport over a number of years—on the one hand, and on the other—figures about birth rate, mortality, morbidity from typhus and relapsing fever. When examining these columns of figures, attention is scattered, despite even the fact that the magnitudes of individual series are brought, as much as possible, into a comparable form. Plotting the comparable magnitudes on a drawing allows one more easily to grasp their meaning and compare their existing fluctuations. The drawing gives a general picture of those dependencies and regularities that exist between economic factors and signs of social health. The main types of graphical representations used to illustrate statistical materials are diagrams (see) and cartograms. On diagrams, statistical magnitudes are represented by geometric lines or figures, while on cartograms, conventional representations of statistical magnitudes are plotted on a geographical map. (For the role and application of graphical representations in variation statistics—see Variation statistics.) The significance of graphical representations in sanitary-educational work is exceptionally great due to the difficulty of understanding and assimilating by the masses numerical series and their relationships, and conversely, the great accessibility of graphical representations to them. Correctly assessing the fundamental importance of graphical representations for social hygiene, Lingner (K. Lingner) as early as his first exhibition in 1903 paid special attention to the methodology of producing graphical representations for popularization purposes and even founded a special statistical bureau, which under the leadership of Roesle first developed scientific methods for constructing graphical representations. In Russia, a huge role in the use of graphical representations for popularizing hygienic knowledge was played by 'sanitary-statistical tables', compiled by Kurkin and published by the Pirogov Commission for the Dissemination of Hygienic Knowledge in 1910 (see Figure 2). To illustrate the internal connection or interrelationship of phenomena, processes, and subjects that do not have numerical expression, graphical representations are used in the form of diagrams. (As examples of diagrams illustrating organizational relationships of organs and institutions in healthcare, see the diagrams in the article Military-medical affairs.) In clinical medicine, graphical representations in the form of diagrams are used for a visual representation of the results of objective examination of patients, for example, examination of skin sensitivity, results of percussion, auscultation, etc. For this purpose, schematic diagrams are usually used. MORTALITY OF EUROPEAN POPULATION BY MONTHS OF THE YEAR. DEATHS FROM TYPHUS.
Related articles
Mentioned in
Cite this page
“Graphical Representations.” Soviet Medical Encyclopedia. English translation of Bolshaya Meditsinskaya Entsiklopediya, 1st ed. (Moscow, 1928–1936), ed. N. A. Semashko. https://sovietmedicalencyclopedia.pages.dev/article/graphical-representations/