Child Mortality
Historical document, translated for reference. It reflects medical knowledge of the 1920s–30s and is not medical advice.
Summary
This article presents statistical data on child mortality rates in various countries and regions, with particular focus on Russia. It examines trends over time, geographical variations, and factors influencing mortality rates, including biological and social characteristics.
Encyclopedia article (1928–1936)
12.6 7.8 9.1 11.6 21.9 19.6 9.7 8.3 16.7 8.6 6.4 11.2 12.1 7.9 7.6 9.7 1917. 20.6 9.6 14.0 21.5 15.0 10.0 8.8 15.7 8.7 6.4 11.8 12.2 7.9 6.5 10.7 1918. 19.3 9.7 13.4 21.7 15.4 19.2 9.3 6.3 11.5 13.8 8.8 6.5 10.1 1919. 1920. 15.6 15.7 8.9 8.0 9.9 10.4 15.9 19.3 14.5 13.1 9.2 9.0 9.0 8.3 12.9 12.7 8.4 7.3 6.7 5.6 13.4 9.7 12.3 9.9 8.2 8.4 6.0 6.3 10.2 9.2 1922. 1923. 15.4 8.3 11.5 19.7 13.4 7.7 7.7 12.9 7.6 5.4 9.5 11.5 7.4 6.5 9.0 15.4 7.7 11.4 20.0 12.9 6.9 6.8 12.6 6.7 5.5 9.9 8.5 7.0 6.3 10.1 13.9 6.9 10.0 18.6 13.2 8.3 7.6 12.7 5.7 5.0 9.2 9.6 6.1 5.6 7.9 1924. 1925. 1927. 12.6 7.5 8.9 19.5 10.8 8.5 8.5 12.8 5.1 10.7 8.5 6.2 6.0 9.8 11.8 7.5 9.4 16.7 10.5 8.1 6.8 11.9 5.0 8.5 8.9 5.8 5.5 9.1 12.4 7.0 9.7 16.8 10.1 8.4 7.4 6.1 8.6 9.7 5.7 5.7 5.7 8.3 6.9 18.5 9.7 7.0 5.9 * From 1919 - post-war territory. Table 2. Child mortality in the first year of life in non-European states (per 100 births). Continents and states 1915. 1916. 1917. 1918. 1919. 1920. 1921. 1922. 1923. 1924. 1925. 1926. America Chile........ Uruguay...... 10.0 25.4 11.1 10.1 24.1 12.4 9.4 26.9 10.7 10.1 25.5 11.0 8.7 30.8 10.0 8.6 26.3 11.7 27.8 10.7 24.0 9.3 7.7 28.3 10.4 7.1 26.6 10.8 7.2 25.8 11.5 10.3 25.1 Asia 16.0 17.0 17.3 18.9 17.5 16.6 16.8 16.6 16.3 15.6 14.2 13.7 Africa South African Union . . 8.6 8.6 8.0 8.2 12.3 8.2 13.6 9.0 13.3 7.7 14.0 7.4 14.3 7.4 15.0 7.4 15.5 6.8 6.3 Australia Australian Union .... New Zealand . 6.7 5.0 7.0 6.1 5.6 4.8 5.9 4.8 6.9 4.5 6.9 5.1 6.6 4.8 5.3 4.2 6.1 4.4 5.7 4.0 5.3 4.0 5.4 4.0 * States where both registration of births and methodological bases are present. From 1/3 to 2/3 and more of all deaths occur among small children; thus, in the joint study of child mortality, the picture of mortality in other age groups would be obscured. To measure child mortality, the ratio of the number of deaths in a certain period of time, for example, in a calendar year, to the number of live births in the same period is used (how many died per 100, per 1,000 births), since in this case we are dealing with a mass of deaths related to very closely related in time masses of births. Attributing the number of dead children to the number of living, as is done when measuring general mortality at other ages, would give incorrect figures, precisely because for the first years of life, census data are not particularly accurate, and the situation would be even worse when studying child mortality in the years between censuses. Where both phenomena (births and cases of death) are correctly accounted for, the adopted method of measurement is the best. It goes without saying that it is more correct to attribute the number of deaths in a given calendar year not to the number of births in that year, but to a certain sum of births in that and previous years, since among those who died in the current year there are also children born in the previous year. Bunyakovsky made his calculations of child mortality in the first year, starting from half the sum of births of the current year and the previous one. Currently, it is customary to attribute the annual number of deaths to births of the current year in the amount of 2/3 (66%) and 1/3 (34%) to births of the previous year. But attributing the deaths in the current year to all births of the same year (provided there is a small difference in the number of births for two consecutive years) facilitates the work and does not give large errors. Tables 1 and 2 present numerical data characterizing child mortality at present and its evolution over a more or less long period of time. Table 3. Child mortality in the first year of life in European Russia (per 100 births). 1887-91.......28.7
1907-11 .....24.4 1887-91 ......26.9 Among European countries, at one end stand the Scandinavian countries (Sweden and Norway) and the Netherlands, as if approaching the biologically possible inevitable low limit of child mortality, and on the other hand Austria, Hungary and Germany-with mortality several times higher than the Scandinavian; close to Norway and Sweden are Denmark, England and Scotland. In the few non-European countries for which reliable data exist, a trend toward a decrease in child mortality is also noted, with the exception of Chile, and New Zealand stands first in this regard. As for European Russia, (as shown in Table 3) here also, although not sharply, a general trend toward a decrease in child mortality is observed, but compared to many European countries, child mortality remains exceptionally high. Compared with the average figures for child mortality in pre-revolutionary Russia, the mortality observed today in individual provinces of the Soviet Union testifies to significant progress in this regard (see Table 4). In 1926, child mortality rises to 22.7 in one Vyatka province, and this province belongs precisely to that belt of the RSFSR which has always been characterized by particularly high mortality. 1This same belt included the provinces of Kaluga, Nizhny Novgorod, Novgorod, Smolensk, Ulyanovsk (former Simbirsk).-Among large cities, Amsterdam and Oslo (Christiania) stand first in terms of low child mortality (see Table 5). Turning to a more detailed study of child mortality according to various biological and social characteristics, it must first be pointed out its dependence on the sex of the child. Everywhere and always without exception, lower mortality is observed among girls than among boys.-This constancy has the character of a biological law. For illustration, only two examples are given (see Figure 1 and Tables 6 and 7).- Mortality among girls is already at birth approximately 18-20%, and in the first month of life-20% lower than among boys. Table 5. Child mortality in the first year of life in some large cities (per 100 born). Cities 1911-13. 1916. 1917. 1918. 1919. 1920. 1921. 1922. 1923. 1924. 1925. 1926. 1927. 7.4 5.9 6.2 6.8 5.8 5.0 5.4 4.7 3.9 3.4 4.5 4.0 4.0 15.1 11.4 14.7 14.5 14.5 16.7 12.5 13.2 11.6 9.7 9.4 8.4 8.6 16.2 12.6 15.5 13.2 14.8 16.7 13.4 16.9 14.8 15.3 15.6 14.1 14.8 15.7 13.1 14.7 15.3 16.1 16.1 13.8 14.0 10.6 10.0 7.9 8.2 8.9 13.0 10.9 12.3 11.2 14.7 12.5 10.2 11.8 8.8 11.7 10.2 10.3 10.8 23,B 27.0 23.6 26.4 23.4 17.3 22.8 13.8 16.8 14.9 14.7 16.7 10.9 8.8 9.7 10.3 8.9 8.5 7.6 7.3 6.1 6.8 6.7 6.3 6.6 26.8 26.8 28.8 26.3 34.4 23.1 23.2 24.5 15.9 18.0 13.4 13.6 13.9 10.6 7.9 6.8 7.9 5.7 5.9 5.2 6.7 4.6 4.6 4.2 4.8 4.5 10.8 9.9 10.1 12.1 11.1 10.9 9.3 8.4 9.0 8.7 8.9 9.7 8.6 22.1 12.3 13.6 13.9 13.3 12.9 14.0 12.7 10.2 11.2 11.1 8.9 9.4 11.4* 12.4 11.9 13.8 9.6 10.2 9.2 9.3 8.9 8.7 8.2 8.1 7.9 8.7 8.3 8.2 7.2 6.0 6.7 6.3 5.4 5.5 5.1 4.5 4.7 5.9 Amsterdam...... Berlin ....... Warsaw....... Vienna......... Glasgow........ Leningrad ...... London....... Moscow........ Oslo (Christiania) . Paris........ Prague........ Rome......... Stockholm ...... * Only for 1913. 78th Table. Died per 100 born in Norway. Years t. Years 7.6 (5.3 7.1 5.8 7.4 5.9 7.3. 6.2 8.3 6.8 7.0 5.8 7.7 6.5 7.4 6.1 7.4 6.1 7.4 6.1 Table 7. Died per 100 born in cities (average numbers of the initial period of the current century). Cities Moscow........ Berlin....... Dresden....... Stuttgart...... Ke =ьn....... Leipzig.....'. . Frankfurt n/M. ... Königsberg .... Munich....... Norwegian cities. Leningrad..... 28.7 25.2 19.8 16.3 19.5 15.8 19.9 16.1 22.6 19.1 21.4 18.2 16.2 13.8 21.5 19.0 21.8 20.3 11.28 9.33 16.1 13.9 mortality among boys. In 1926 in Leningrad the relationship between mortality
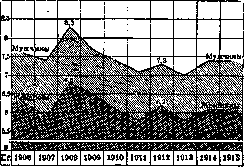
Figure 1. Mortality in Norway per 100 born in 1906-15.
of boys and of girls by separate months of life were characterized as follows: Table 8. Mortality of boys in % to corresponding mortality of girls. Age in months % Age in months % 119.5 118.6 118.9 118.4 116.8 115.0 113.8 116.8 113.8 112.9 110.0 108.8 With each month this difference decreases, but it persists until the end of the year and even up to 5 years of age. The causes of the lower viability of boys are currently unknown. A newborn child, as Bertillon says, has as much chance of dying within a year as an 88-year-old old man; in relation to boys these chances are even greater. According to Baden statistics, out of 1,000 births, 9 cases of death occur in the first hour of life, in the next 11 hours of the same day - 11.4 cases, and in the second half of the first day - 2.9 cases of death. By days of the first month of life, child mortality is shown in the following table according to many years of observations in Petrograd. Table 9. Out of 100 born, died in Petrograd in 1906-15. Days
0.14065 From the table it is seen that the probability of dying within the first day of life is 7 times greater than the probability of dying on the seventh day of life. The probability of death in the first week of life is 6 times greater than the probability of death in the 4th week from birth, and the probability of death in the entire first month of life is five times higher than the probability of death during the twelfth month. Thus, the closer to the moment of birth, the greater dangers the child's life is exposed to. The most severe is the first week of the first month of life, during which half or more of the children who die during the first month of life perish, and the first month accounts for 1/i or more of all deaths of the entire year. - Child mortality in different months and seasons of the calendar year, as well as mortality of other age groups, is not the same and has a specificity characteristic only of this age group. The monthly distribution of deaths at age 0-1 in European Russia for 1900-04 gives the following figures. With an average daily (from the annual) number of 100, died in European Russia at age 0-1: in January - 80, in February - 82, in March - 86, in April - 87, in May - 85, in June - 131, in July - 172, in August - £40, in September - 91, in October - 75, in November - 83 and in December - 86. A gradual increase in deaths is noted from the beginning of the year, a sharp increase in them in the summer months, especially in July, after which their number again falls approximately to the figures of the first months of the year. The distribution of deceased children by months of the year and seasons in relation to the total sum of deceased, taken as 100, according to observations in the Moscow province and in Petrograd is given in Fig. 2 and in Table 14. With a great similarity of both series, they nevertheless have their own peculiarities. In both the Moscow province and Petrograd, the most favorable month is October, the most unfavorable is July. In both places, autumn gives the smallest number of deaths, and the most unfavorable season is summer. But while in the city spring, due to its unfavorable nature, differs little from summer, in the province the increase in the number of deaths in summer time appears much more sharply. In general, in the city, deaths are distributed more evenly by seasons than is noted for the Moscow province. The decomposition of the entire sum of deceased in the first year of life in the Moscow province into smaller groups in relation to the number of deceased in each group, taken as 100, gives the following results. Table 15. Died in % to the total sum of deceased, taken as 100, in the Moscow province (1883-97). Months and seasons of the year Months of the 1st year of life December ..... January...... February..... Winter....... March....... April ...... May........ Spring....... June........10 July........ 13 August . Summer . . September October November . Autumn........ 19 ,19 ,90 ,78 ,87 ,04 ,56 ,44 ,04 ,21 05 ,35 ,61 ,80 ,19 ,49 5.88 6.16 6.09 18.11 6.87 6.17 7.43 20.47 12.95 16.40 13.12 42.47 7.60 5.52 5.82 18.94 4-6
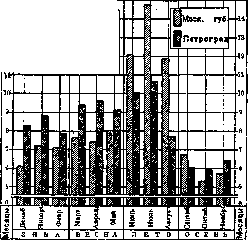
Figure 2.
life in five times higher than the probability of death during the twelfth month. Thus, the closer to the moment of birth, the greater dangers the child's life is exposed to. The most severe is the first week of the first month of life, during which half or more of the children who die during the first month of life perish, and the first month accounts for 1/i or more of all deaths of the entire year. - Child mortality in different months and seasons of the calendar year, as well as mortality of other age groups, is not the same and has a specificity characteristic only of this age group. The monthly distribution of deaths at age 0-1 in European Russia for 1900-04 gives the following figures. With an average daily (from the annual) number of 100, died in European Russia at age 0-1: in January - 80, in February - 82, in March - 86, in April - 87, in May - 85, in June - 131, in July - 172, in August - £40, in September - 91, in October - 75, in November - 83 and in December - 86. A gradual increase in deaths is noted from the beginning of the year, a sharp increase in them in the summer months, especially in July, after which their number again falls approximately to the figures of the first months of the year. The distribution of deceased children by months of the year and seasons in relation to the total sum of deceased, taken as 100, according to observations in the Moscow province and in Petrograd is given in Fig. 2 and in Table 14. With a great similarity of both series, they nevertheless have their own peculiarities. In both the Moscow province and Petrograd, the most favorable month is October, the most unfavorable is July. In both places, autumn gives the smallest number of deaths, and the most unfavorable season is summer. But while in the city spring, due to its unfavorable nature, differs little from summer, in the province the increase in the number of deaths in summer time appears much more sharply. In general, in the city, deaths are distributed more evenly by seasons than is noted for the Moscow province. The decomposition of the entire sum of deceased in the first year of life in the Moscow province into smaller groups in relation to the number of deceased in each group, taken as 100, gives the following results. Table 15. Died in % to the total sum of deceased, taken as 100, in the Moscow province (1883-97). Months and seasons of the year Months of the 1st year of life December ..... January...... February..... Winter....... March....... April ...... May........ Spring....... June........10 July........ 13 August . Summer . . September October November . Autumn........ 19 ,19 ,90 ,78 ,87 ,04 ,56 ,44 ,04 ,21 05 ,35 ,61 ,80 ,19 ,49 5.88 6.16 6.09 18.11 6.87 6.17 7.43 20.47 12.95 16.40 13.12 42.47 7.60 5.52 5.82 18.94 4-6
7-12 6,20 7,21 6,71 20,12 6,69 6,09 7,95 20,73 13,65 16,50 12,35 42,50 6,35 4,90 5,40 16,65 6,29 7,41 7,74 21,44 8,87 8,78 9,14 26,79 11,49 13,13 10,79 35,41 6,20 4,85 5,30 16,35 And when the deceased children of the first year are divided into smaller groups, the basic features and types of child mortality by calendar months and seasons are preserved: the most favorable season is autumn and the most favorable month is October; the most unfavorable season is summer. The increased child mortality in summer has been noted for a long time and almost everywhere. The summer increase in mortality, caused by gastrointestinal diseases, besides the combination of household and social factors, on which the degree of this increase depends, is dependent (as confirmed by all studies) on the meteorological conditions of a given summer, mainly on temperature: the higher the latter in the summer months, and moreover the less precipitation falls, the more difficult the conditions for the child's organism, the higher the child mortality (see Table 16). July 1927 and August 1924 show the highest mortality, and it is precisely in these months that there is a high temperature and relatively little precipitation. Mortality is low in July 1923, and this corresponds to a comparatively low temperature, although accompanied by a small amount of precipitation. It should be noted that in the nearest time to us, apparently in connection with the improvement of cultural and living conditions of the urban population, the summer maximum of child mortality is losing its character of being obligatory, which is completely obvious, for example, from Table 17.
Table 17. Mortality of children in the first year of life in German cities in 1927 (per 100 births). Cities with population over 50,000. Months January Berlin..... 10,26 10,35 10,49 February 10,23 10,75 11,91 March . . 9,36 10,01 10,32 April . 8,58 8,89 8,89 May . . . 1 7,87 8,39 8,30 June.. 1 8,12 8,10 8,15 July . . 6,98 7,49 7,73 August . 6,85 7,85 9,72 September 8,66 8,09 8,64 October 8,02 8,41 8,59 November . 8,09 8,38 9,53 December 9,61 9,95 9,49 For the year . . 8,57 8,88 9,33 Table 18. Per 1,000 births died in the first year of life. Causes of death 1911- 1913. 1920. 1921. 1922. 1923. 1924. 1925. 1926. 1927. Congenital weakness and defects 53,6 50,0 84,6 27,4 22,8 69,4 29,2 52,5 27,4 24,5 67,4 27,9 33,6 21,0 22,7 59,1 44,9 66,0 33,0 25,2 48,1 23,8 28,8 21,1 16,3 43,9 33,4 42,1 29,1 19,3 42,0 26,0 38,7 27,5 14,8 39,4 30,5 34,8 27,5 15,2 3»;8 31,2 49,0 35,0 12,0 Gastrointestinal diseases. . Total . . . 238,3 203,0 172,6 223,2 138,1 167,8 149,0 147,4 167,0
According to many years of observations in the zone of Central Russia, mainly in the Moscow province, it was established that in the rural population the danger threatening the life of a newborn is not the same for those born in different months of the year, and children born in April, May and June, i.e., in months close to the July maximum of child mortality, or at the height of high child mortality in July, are in the most unfavorable conditions for survival; on the contrary, those born in autumn-winter months are already more resistant by July. Thus, those born in winter and autumn have more chances to survive to the end of the first year than those born in spring and summer; hence it follows that conceptions of July, August and September will give children in less favorable conditions than conceptions of December, January, April and May. And this or that moment of conception in rural conditions depends on a complex combination of biological, household and social factors, the influence of which in urban conditions is significantly weaker. Therefore, in cities conceptions (and consequently births) are distributed more evenly over the calendar months of the year. Table 18 provides data on the main causes of death of children under 1 year according to many years of observations in Leningrad. The highlighted causes cover up to 90% of all deaths. As can be seen, the figures from year to year, with a general trend to decrease, undergo large fluctuations; these fluctuations are especially sharply expressed in relation to gastrointestinal diseases. The size of the latter is determined mainly by the summer maximum. The question of the so-called marital and extramarital births, which has lost some interest in the USSR, has retained all its significance in all other countries, and in relation to child mortality a significant excess of it among extramarital children compared to those born in marriage is noted everywhere and always. This difference is due primarily to the moral and social hardships that fall to the lot of the mother, and cannot but have the most fatal effect on the fate of the newborn. How great child mortality is among extramarital children is evident from the following numerical data.
25.1 In Hesse for 1907, with an overall child mortality of 13.0, child mortality among Jews was 6.4; in Budapest for 1902 and 1903, among Jews it was 9.2 and 9.7, among non-Jews - 16.4 and 15.4; in Amsterdam for 1907-09 - among Jews 7.5, non-Jews 9.0. The undoubtedly existing low child mortality among Jews must of course not be explained by any racial peculiarities, but is the result of prolonged breastfeeding of children and careful care of them. Lower child mortality goes in parallel with sharply falling birth rates among them. Undoubtedly, the living conditions of the population, meaning the various factors that characterize the material, cultural, and other resources of a given population group, have a huge influence on the level of child mortality. Statistically, an inverse parallelism has been established between the level of child mortality and one or another degree of prosperity and the resulting housing conditions, working conditions, education, etc., in the sense that the lower the prosperity, the higher the child mortality. When dividing 20 districts of Paris by the degree of prosperity of residents into 4 groups, the following picture of general and child mortality is obtained (observation period - 1911-13). Table 21. Population groups Out of 100 households, exempt from taxes General mortality Child mortality per 10,000 deaths Affluent . . . Very poor . . . Average for all groups . ... 45.9 64.1 79.0 89.2 74.2 11.0 13.0 16.9 22.4 16.5 5.1 6.9 10.7 15.1 14.1 14.3 26.8 43.1 58.6 39.4 Table 22. Apartments With breastfeeding With artificial feeding In 1-2 rooms ! » 3 » » 4 and more . . 4.9 2.6 2.6 22.9 16.9 10.3 17.7 12.8 7.3 The method of feeding infants has enormous importance in the question of child mortality. This best determines the differences in child mortality. Statistical studies by Boeckh, dating back to the late 1870s, and repeatedly confirmed by subsequent research, firmly established that on average in the first year of life, child mortality with mother's milk feeding is 8 times lower than with animal milk feeding. The decisive factor is not the fact of breastfeeding itself, but proper feeding. In the USSR, 95% of women breastfeed, yet child mortality in the USSR is still higher than in other European countries. Therefore, along with breastfeeding, the work of infant consultations is of great importance. In countries with low child mortality (in Sweden, Norway, Denmark, Ireland), prolonged breastfeeding of children by mothers is a common phenomenon. If in Germany during the war years no significant increase in child mortality was noted, the explanation for this fact should be sought in the practical implementation of the law on assistance to breastfeeding, which made it possible to keep children on breast milk for a longer time. It was noted that during the siege of Paris in 1870, despite the general distress, child mortality significantly decreased due to the lack of cow's milk, children remained on breastfeeding longer. The average child mortality in Berlin daily (on average) per 100 births is given in Table 23. In Barmen in 1904-05, the mortality of children who were on breastfeeding for three summer months did not increase at all, while the mortality of children on mixed feeding increased by 190%, and that of artificially fed children increased by Table 23. Months During 3 summer months (July-September)...... During the other 9 months ............. * In July the temperature was low. Children on breastfeeding Children on artificial feeding 1904 1905 | 1906 J1907» 1903 G. 1904 g. 1E05 g. 1906 g. 1907 G.* 1903 G. 2.11 1.88 2.24 1.92 2.13 23.40 24.13 18.65 9.86 12.97 1.94 1.84 2.19 2.38 2.16 11.11 10.51 8.97 8.96 7.59 Here it is clearly seen that general mortality, child mortality, and mortality from tuberculosis go in parallel. According to Barmen statistics in 1904-05, died per 100 births: among persons with an annual income below 1,500 marks - children breastfed 7.3, artificially fed - 31.6; among persons with an annual income above 1,500 m. - breastfed 6.4, artificially fed -12.5. In 1906, child mortality in Berlin in connection with housing conditions was as follows. 225%. Depending on the duration of breastfeeding, the mortality of married infants per 100 births in Cologne (1908-09) was as follows (see Table 24). Statistics on breastfeeding in terms of its prevalence in different localities and duration are associated with certain difficulties. In old Berlin population censuses, questions were asked about the methods of feeding children counted by these censuses. The correct organization of the statistical study of methods of feeding infants would have great scientific and practical significance. Differences in child mortality in cities and rural areas at different times, even in the same localities, are subject to large fluctuations. When artificial feeding predominates in a given locality, more favorable conditions are created for urban children due to the higher cultural level of parents, who in the city also have more opportunities to use the advice of consultations on infant care. In cities of the USSR, consultations cover 70% of children under 1 year, which undoubtedly had a more pronounced effect on the reduction of child mortality compared to rural areas. For a more distant period from us, a higher child mortality in cities than in rural areas was noted. Such observations exist regarding Sweden, England, Prussia, etc. Thus, in Prussia the following picture was observed. Table 25. Mortality per 100 births. Legitimate children Illegitimate children in cities in rural areas in cities in rural areas 1881-85 . . . 1901-05 . . . 21.1 18.1 18.6 17.8 39.8 38.9 31.9 J 32.2 For later years in Prussia, the following relationships were observed: Table 26. Child mortality in Prussia (per 100 births). Years In cities In rural areas 14.2 14.4 13.51 12.9 14.9 15.2 13.28 14.18 13 7 In European Russia in the pre-revolutionary period, no special difference in child mortality between cities and rural areas was noted. Higher child mortality in cities of capitalist countries is to a large extent connected with the participation of women in factory work, while at the same time there is no systematic protection of motherhood and infancy. According to the statistics of the Central Statistical Committee, child mortality among mothers employed outside the home - 17.6%; artisans working at home - 11.4%; not employed - 9.8%. The professional statistics of England provide instructive material on the influence of parents' professional labor on the mortality of their infants; this is especially noted in metal processing (lead). Thus, with an overall child mortality of qualified workers equal to 7.7% of births, for the group of foundry workers it is 9.6%, file grinders - 10.2%, painters of pottery - 13.8%, glazers - even 14.7% (1921). St. Petersburg statistics of 1911 shows that child mortality among mothers engaged in housework is 19.5, and among those engaged in hired labor - 25.9. As a result of social insurance for motherhood and other measures for the protection of motherhood and infancy, we have the following changes in child mortality in areas with extensive use of female labor (in percentages). Table 27. 1912 1928 Ivanovo-Voznesensk province...... 34.9
16.0 In the problem of child mortality, there are a number of complex questions that have not yet received a final resolution. One of such questions is the question of the connection and dependence between birth rate and child mortality. The numerous existing studies on this matter do not provide a final resolution of this question. In one of the latest works on this question (S. A. Novoselsky), there are indications that under conditions of unregulated reproduction, the direct connection between fertility and child mortality is insignificant, and the territorial coincidences of high birth rate with high child mortality and vice versa are caused primarily by the common influences of demographic, domestic, and socio-economic factors; that there is no connection between the height of the birth rate and the height of child mortality in the same year; and that in some cases there is a weakly expressed connection between birth rate and child death in the following year, while in most cases this connection is absent. - The question of the influence of parents' age on the viability of offspring has also not been resolved. G. Mayr thus presents the conclusions of Korosy from his research on this question: girls should not marry before the age of 20; old men should not marry young women, and women in more mature age, when choosing a husband older than 50, should not fear unfavorable chances, and conversely, in such women (even between 30 and 35 years), if they choose young men as husbands, their children more often suffer from hydrocephalus and congenital weakness. - Among the complex questions in the field of child mortality is also the question of the viability of children depending on their order of appearance. Along with opinions about the low viability of firstborns, about their not only physical but also mental and moral instability (Pearson), there are opinions that consider such a statement, at any rate for the time being, insufficiently substantiated. These questions also include the causes of increased child mortality in large families, i.e., essentially the connection between birth rate and mortality, the beneficial influence in terms of child survival of long intervals between births (not less than two years), and the regulating significance of these pauses for birth rate, especially in connection with breastfeeding, etc. Ultimately, the complex problem of child mortality is predominantly a social problem, a problem of the struggle against poverty and lack of culture, victory over which should lower child mortality to its inevitable minimum determined by biological causes, and in the ideal—to zero.
Related articles
Mentioned in
Cite this page
“Child Mortality.” Soviet Medical Encyclopedia. English translation of Bolshaya Meditsinskaya Entsiklopediya, 1st ed. (Moscow, 1928–1936), ed. N. A. Semashko. https://sovietmedicalencyclopedia.pages.dev/article/child-mortality/