Nutrition
Historical document, translated for reference. It reflects medical knowledge of the 1920s–30s and is not medical advice.
Summary
This article examines nutrition as a biological and social phenomenon, discussing its historical development and socio-economic aspects in capitalist and Soviet societies. It explores how labor, the use of tools, and the consumption of meat influenced human evolution and societal structures.
Encyclopedia article (1928–1936)
38 The problem of N. in capitalist society. 80 Physiological characteristics of foodstuffs and principles of compiling food rations . . . ....... ...... 85 III. Significance of food regimens in pathology .... 91 IV. Nutrition of children. Physiology of childhood N.............. 94 . Disorders of digestion and N. in early childhood.................. юз Public child nutrition..............109 Nutrition is the basic biological need of humans. The character and degree of resolution of this task determine the "vitality, capacity for work, and stability of the human organism. The scientific study of the problem of N. covers, on one hand, a series of questions of collective life—the production, distribution, exchange, and consumption of products and their preparation as food, and on the other—with respect to the individual organism—a series of processes related to the activity of the gastrointestinal tract and its appendages (acts of food intake, chewing, movement along the intestine, processes of secretion, digestion, and absorption), and the entire fate of food substances after their absorption until the excretion of decay products outside. The problem of N. as a socio-hygienic problem. Nutrition as a socio-economic and socio-hygienic problem in the USSR is the most serious state task, having vital significance for the broadest working masses. N. is the basic biological need of humans. For a scientific understanding of the development of the problem of N., it is necessary to examine the problem of N. in a historical perspective, in the perspective of the development of human society, in the light of changes in social relations and the development of scientific knowledge. The examination of socio-economic aspects of N. in bourgeois countries by bourgeois scientists is carried out without an analysis of the roots of socio-class relations, separately and in isolation from class struggle, outside the basic contradictions of capitalism. As a result of this, the artificially separated biological side not only became a priori for these scientists, but research in the field of N. was concentrated on the individual, the particular animal, a part of the animal world, whereas the truly scientific method in the study of problems of N. in a socio-hygienic perspective will be the method of studying from the collective to the individual, and not vice versa. Marx, analyzing the connection and interdependence of the processes of production and distribution, exchange, and consumption of products, says that "production, distribution, exchange, and consumption form parts of a whole, differences within unity, ... a certain form of production determines certain forms of consumption, distribution, exchange, and certain relations of these different moments to each other" (K. Marx, "Toward a Critique of Political Economy", p. 68, M.-L., 1930).
The problem of nutrition in the light of the historical development of human society. Engels in his work "The Role of Labor in the Process of Humanization of the Ape" pointed to the determining role of labor in the evolution of man and substantiated the dialectical synthesis of the biological and social, proving that people are part of nature, but a special part. "In what do we again find the characteristic feature of human society, distinguishing it from a herd of apes?—In labor. The herd of apes was content with consuming the ready-made food reserves provided by nature, the size of which was determined by geographical conditions or the degree of resistance of neighboring herds. It roamed—from place to place, striving through struggle for a new, rich in food area, but it was unable to extract from the area providing it with food more than what this area gave from nature, except perhaps for what the herd unconsciously fertilized the soil with its excrement... But all animals are extremely wasteful in relation to food items and often destroy their natural increase in the bud... This 'predatory economy' of animals plays an important role in the process of changing species, as it forces them to adapt to new, unusual kinds of food, thanks to which the blood acquires a different chemical composition and the entire physical constitution gradually becomes different, while species established once and for all become extinct. There is no doubt that this predatory economy greatly contributed to the humanization of our ancestors. Of that race of apes which surpassed all others in intelligence and adaptability, this predatory economy must have led to the fact that an ever-increasing quantity of new plants, and from these plants, an ever-increasing quantity of edible parts, began to be used as food; in other words—to the fact that food became more varied, which resulted in the penetration into the organism of increasingly diverse elements that created the chemical prerequisites for humanization. But here labor, in the proper sense of the word, played no role. The process of labor begins only with the making of tools. And what are the most ancient tools that we find... These tools are tools for hunting and fishing; the first are at the same time objects of armament. But hunting and fishing presuppose a transition from the exclusive use of plant food to the consumption along with it of meat, and this marks a new important step on the path to humanization. Meat food contains in almost ready form the most important elements in which the organism needs for its metabolism. Meat food shortened both the process of digestion and the duration of other phenomena corresponding to the plant kingdom, plant processes in the organism, thereby saving more time, elements, and energy for the active manifestation of animal, in the proper sense of the word, life. And the more the developing man moves away from the plant kingdom, the more he also rose above the animal... However, the most significant influence meat food had on the brain, which received from it in greater quantity than before the substances it needs for its N. and development, which gave it the opportunity to perfect itself more quickly and more fully from generation to generation. Risking to arouse the anger of the vegetarian masters, one has to admit that meat food was a necessary prerequisite for the development of man, and if the consumption of meat food by all peoples known to us at one time or another led even to cannibalism..., that is none of our business now. The introduction of meat food into consumption led to two improvements of enormous significance: the use of fire and the domestication of animals. The first further shortened the process of digestion, as it provides, so to speak, already half-digested food to the mouth; the second enriched the reserves of meat food, as along with hunting it opened a new source from which it could be regularly drawn, and provided in the form of milk and its products a new element in diversity, equivalent to meat, as an article of food. Thus both these improvements became directly means of emancipation for man..." The social regularity in the development of people and human society lies in the fact that with the appearance of tools of labor, i.e., production, the process of appropriation of tools of labor began, the process of concentration of tools of labor in the hands of the top of a given social formation, historically changing in forms and methods. Under these conditions food, the composition and methods of obtaining and distributing it among people (and methods of intake) historically change, subject to historically developing laws of production relations. Thus the domination of man over nature has in the further development of humanity different consequences for different groups of people. With the appearance of tools of labor and the change in production relations, not only the methods of obtaining food changed, but also the methods of its distribution in society. The methods and forms of food intake also changed. In a subordinate, dependent position in relation to the products of N. (to the methods and forms of food consumption) naturally ended up population groups that were deprived or deprived of the means of production. Marx characterized the consumption of individual socio-class groups of the population in different historical epochs as follows: "The slave, the serf, the hired worker—all receive a certain amount of food which enables them to exist as a slave, as a serf, as a hired worker". And further Marx says: "Distribution in the most superficial understanding appears as distribution of products and thus, as further removed from production, and in relation to it apparently independent. However, before distribution is distribution of products, it is: 1) distribution of means of production and 2)—which represents a further development, determination of the same relation—distribution of members of society among different kinds of production (subordination of individuals to certain production relations). Distribution of products is obviously only the result of this distribution which is contained within the process of production itself and which determines the structure of production" (K. Marx "Toward a Critique of Political Economy", p. 22, M., 1933). History has preserved little data on N. of humans in different epochs. Of interest are the views on the problem of N., created in the slave-owning society of the ancient world. From.
Several of Hippocrates' statements on the subject of N. have been preserved: 1) one must know all food substances and beverages used by humans, as well as their properties; 2) know how to weaken or enhance the natural properties of each food substance; 3) one must know the relationship between the amount of food and physical exertion; 4) the amount of food consumed depends on constitution, age, time of year, weather, and locality. According to Herodicus of Selimbria, the cause of most diseases lies in the violation of the normal state of equilibrium between the food we consume and the work we produce. Euryphon of Knidos saw the cause of all diseases in the immoderate consumption of food. These views on the importance of nutrition did not express the prevailing philosophy of that era and stemmed from a limited worldview. Pythagororas (5th century B.C.E.) preached abstinence from meat, eating only twice a day, consisting of bread, honey, and raw and cooked vegetables. Plato and Empedocles maintained that moderation in all things, and first of all in food, is the guarantee of a happy life. In Homer, the word "food" refers only to bread, while everything else is called "condiments." Slave-owning society has not left us sufficient information about the nutrition of different social groups of the population. Little data has also been preserved on the economics of this problem. In the era of feudalism, when the closed economy of the feudal lord, in which the production of food products was carried out by primitive methods, and the exchange of products of serf and artisan labor took place at the nearest market, the nutrition of the population was marked by a natural economy. From this era, information has been preserved about terrible famines, inevitable under such a system of management and under the most ruthless exploitation of the working population, which manifested itself particularly sharply with respect to serf peasants. The development of trade relations between countries, the discovery of new countries at the end of the Middle Ages, intensified the class differentiation of society, but at the same time increased the assortment of food products consumed and led to the fact that the exploited classes continued to be undernourished, although with foreign products. This was the case in Ireland with American potatoes, this was the case in Europe with onions brought from the East as a condiment for the tables of feudal lords, merchants, etc. So-called national dishes, the national limitations in the nutrition of individual peoples, under conditions of the development of international trade relations, must therefore be considered as an artificially, on the basis of class differences or colonial oppression, delayed process of changing the structure of nutrition. We still have today in colonial countries many peoples whose productive forces are frozen at the level of almost primitive human society, and in these cases we have peculiarities of their nutrition, which1 by no means depend on geographical, climatic and other natural conditions. Religion played a significant role in consolidating class inequality in N. In this respect, the role of religion in the religious formalization of periodic famines of the working population in the form of so-called fasts is particularly prominent. Christianity played a particularly outstanding role in the divine legalization of undernourishment: for "Orthodox" believers, about 50% of all days in the year were established as fast days. In especially difficult seasons, when the vast majority of peasants had nothing to eat without usurious loans, an especially severe "Great Lent" was established for 49 days. These examples can be expanded to other religious teachings. The forty-day fast of Muslims, which falls on the summer working period, heavily strikes the working population and especially the farm laborers. During this fast, food is only permitted in the evening. In the practice of the working population, this permission amounts to great economy in food products for landowners who use hired labor (and other groups of exploiters), and for those who sell their labor, to prolonged, exhausting undernourishment. It is characteristic that so-called fasts were observed mainly by the "common people" and were not observed or almost not observed by all the "rest of the people." Some bourgeois scientists attempted to explain the inequality in N. of different classes of the population in their own way. The inevitability of undernourishment of the broad working masses is justified in capitalist society theoretically or from the point of view of overpopulation, and specifically of the working population, at the simultaneous lack of food products (Malthus), or from the point of view of unsatisfactory distribution of products of human labor, which follows from the "laws" determining the exchange value of commodities (Ricardo), from the "laws" of the development of economic life determining the level of the working class's wages (Lassalle, "the Iron Law of Wages"), etc. Ricardo's doctrine of the decreasing fertility of the soil, known as the "law of decreasing fertility," is a continuation of Malthus's concept and represents a saving formula for justifying the inevitability of unsatisfactory nutrition of the broad masses of the population. The prevalence of this reactionary "law of decreasing fertility of the land" among representatives of bourgeois science is very significant. This is understandable, since the defenders of this law need to seek the cause of the rising price of bread, the deterioration in the food supply of the population, the cause of social distress, not in the nature of the capitalist system of production, but "in natural conditions independent of man." From the vicious circle of the law of capitalist accumulation, the working class cannot escape while remaining within the capitalist system, but the working class immediately gains this possibility at the moment when it ends with the capitalist mode of production. The problem of nutrition in capitalist society. The development of capitalism in resolving the problem of N. determined the transformation of food products into commodities, in the order of exchange far exceeding the territory or state where this commodity is produced. In capitalist society, the production of food products is subject to the general laws of capitalist production. Capitalism produced a giant revolution in agriculture, transforming the routine craft of peasants into the scientific application of agronomy, breaking the centuries-old stagnation in agriculture, giving impetus to the rapid development of productive forces. The application of machinery in agriculture was created and began to grow rapidly, the application of steam; the application of electricity began, which is destined to play an even larger role in this branch of production than steam. The development of branch lines, land reclamation, the use of artificial fertilizers in accordance with the data of plant physiology, the application of bacteriology to agriculture took place. This revolution is connected with the growth of the market (in particular with the growth of cities), subjecting agriculture to competition, which forced the transformation of agriculture and its specialization. The capitalist intensification of agriculture also led to specialization in the production of food products. In this production, a historical step was taken from the production of food products in a natural economy for the consumption of these products within the economy to the formation of meat, pork, wheat and other trusts, to the domination of food products by banks or associations of banks. The greatest technical progress in the production of food products was accompanied not only by their absolute increase but also by progress in their processing, storage, and transportation. Scientific discoveries in the fields of chemistry, physics, biology, epidemiology, etc. raised the issues of sanitary protection of the quality of food products to an unprecedented height, made it possible to discover the elements of biological completeness of certain products (the doctrine of vitamins, of complete protein), made it possible to deeply penetrate the problem of metabolism in the body, etc. This historical achievement of capitalism in the field of nutrition, under the contradictions of capitalism, was inevitably accompanied by the formation and development of class inequality in nutrition. Under these conditions, attempts at a scientific justification of abstinence in food, vegetarianism, the need for the working class to consume mainly plant-carbohydrate food, etc., acquire a political orientation directed against the working class. Abstinence in food, simple food, plant food is recommended for workers by bourgeois scientists. It has become difficult to judge the N. of the population of any country by the quantity and assortment of products produced in that country. For example, in Denmark in 1925, 152,112 tons of butter were produced, or about 43 kg per capita. However, in the same year, 132,502 tons of butter were exported from Denmark, and per capita consumption of margarine rose to 20 kg per year. While butter production increased by 38% since 1913, exports increased by 84%. From tsarist Russia in 1913, 78,000 tons of butter were exported with a per capita consumption of about 1 kg per year, and consumption of this product in the Kaluga province and milk in the Kherson province reached zero.
Statistical calculations of per capita consumption of individual products of N. in different countries, given as average figures for the entire population, do not in any way reflect the nature of N. of individual socio-economic groups. Consumption of products of N. by the urban population is subject to the general laws of capitalist development, having at different stages of capitalist development in different countries its own characteristics inherent to the city. Food products are mainly acquired by the urban population on the market. N. of the urban population is to a greater extent than in the countryside determined by the purchasing power of individual socio-class groups of the city's population. The profound crisis that has now engulfed the world has further exacerbated all the contradictions tearing capitalism apart. The unprecedented growth of unemployment, the advance of capital that worsens working conditions and reduces wages, lead to new impoverishment of the masses, to a sharp deterioration in N. of the working class. The fall in prices on the world market for bread and other food products, caused by the economic crisis, has led to an intensification of the struggle for sales markets and is ruining huge masses of the peasantry. All this sharply reduces the purchasing power of the population and in turn further exacerbates the crisis. The general crisis of capitalism is inextricably intertwined with the agrarian crisis, which has already lasted for more than a decade and has already led and is currently leading to the ruin of tens of millions of peasant farms. The agrarian crisis has primarily struck agricultural producers with the rapid fall in prices for products. The index of prices for all goods in the USA in August 1931 was 2 times lower than the index of August 1929 and 25% lower than the index of the pre-war five-year period (1909-1914). The index of prices for farm products, according to the Department of Agriculture in the USA, was 94 in January 1931, fell to 79 in August, while the index of retail prices for industrial goods purchased by farmers was 138 and 129 respectively. Table 1. Movement of prices for the most important products of agriculture (prices of 1926 taken as 100). Farm products Index of prices received by farmers September 1929 September 1930 January 1931 March 1931 Wheat ... 83 Beef ... 113 Mutton ... 96 52 102 44 99 65 43 93 59 Before the crisis, the share of agriculture in the national income of the USA never fell below 20%, at present it amounts to only 9.3%. The fall in prices for agricultural products mainly hits small-scale farming. If large farms (before the crisis in the USA there were 12-15% of all farms) with lower cost per unit, with the further mechanization and intensified exploitation of hired workers with the support of banks can hold out during the crisis, and sometimes even make significant profits, then for the overwhelming majority of small and medium farmers the prospect is one: hunger, impoverishment, ruin, flight from the land, addition to the ranks of the unemployed. Along with the proletarianization of small farmers, small peasants, there is a further process of concentration of capitalist agriculture. Over the last decade (1920-1930) in the USA, the number of farms in own use decreased by 300 thousand (from 3.9 million to 3.6 million). The share of tenants was 38.1% in 1920, 38.6% in 1925, and 42.4% in 1930. With a reduction in the total number of small and medium farms, we have an increase in the number of large farms. Over the decade, the number of farms of 500-999 acres increased from 149 thousand to 169 thousand; the number of farms of 1000 acres and more increased from 67 thousand to 80 thousand. The agrarian crisis is deepening, leading to a complete disorganization of the world market for food products, due to the introduction of various kinds of protective and preferential tariffs. Tariffs on wheat before 1931 in Germany exceeded tariffs of 1928 by 5 times, in Austria by 3 times, in France by 2.5 times, in Poland by 3 times, in Czechoslovakia by 2 times, while wheat prices fell by 50-60% during this time. Agrarian protectionism means shifting the burden of the agrarian crisis onto the working masses, leading to a sharp deterioration in nutrition. In Germany, the import of food products from abroad before the war constituted the main item in the passive balance of German trade. In 1931, the import of products of N. decreased by 15% compared to the previous year. In the first half of 1931, 5,519 million double centners of food products were imported into Germany, worth 196.7 million marks. In the second half of 1931, 5,123 million double centners of food were imported for 211 million marks. The increase in the cost of imports with a simultaneous decrease in the physical volume of imported products was actually more significant, as it occurred under conditions of falling wholesale prices. It is very telling that the reduction in the import of food items occurred at the expense of consumer goods for the masses, while the import of high-value products of N. decreased to a lesser extent. These data have profound social significance. They indicate that the reduction in the import of food items is due not to a decrease in the living standard of the wealthy classes, but to a reduction in consumption by the working masses. According to the Prussian Statistical Bureau, in May 1931 there was a new increase in prices for bread, buns, rye flour, wheat flour, sugar, potatoes. Compared to April 1931, bread became more expensive by 2.8%, and compared to January - even by 5%. Potatoes in May 1931 became more expensive by 13.3% compared to April and by 33.7% compared to January. Meat consumption per capita is decreasing significantly. If in 1912 meat consumption per capita was 59 kg, in 1926 - 57.2 kg, in 1928 - 52.8 kg, in 1929 - 51.7 kg, and in the first 3 quarters of 1930 - 36.8 kg. Per capita flour consumption fell from 108.6 kg in 1928/29 to 89.4 kg in 1930/31. A vivid characterization of the relationship between the wholesale price index, retail price index and the cost of living index is given by the 'International Commercial Institute of the United States of North America' (prices of 1914 taken as 100). Table 2. Wholesale price index Retail price index Cost of living index September 1929 January 1930 May 1930 115.2 141.2 134.1 126.0 117.8 102.3 100.0 160.8 155.4 360.1 146.6 132.8 122.0 163 160 157 153 140 September 1930 January 1931 May 1931 June 1931 This table gives a vivid characterization of the fact that the reduction in wholesale prices with a relatively slow reduction in retail prices at their high level leads to a decrease in the living standard of workers. In Germany, there was even an increase in retail prices (Berlin Statistical Bureau) from January to June 1930 for bread, flour, greens, potatoes, eggs, margarine, etc. At the beginning of 1931, the price index for plant products was still at 111.6; in May 1931 it rose to 132.2. Compared to April 1930, bread in May 1931 became more expensive by 2.8%, and compared to January - even by 5%. Potatoes became more expensive by 13.3%. This price increase occurred simultaneously with a 15% decrease in wages, a 45% increase in the intensity of labor compared to 1924, and an increase in the number of unemployed by 1,000,000 people. These phenomena are also present in other countries. It should be noted that the fall in wholesale prices for products of N. is accompanied by a fall in the purchasing power of the broad masses of workers, which leads, on the one hand, to a decrease in the consumption of food products and the formation of huge 'reserves' of these products and their direct destruction, to the use of butter for lubricating machines, corn, wheat, coffee, etc. for heating purposes. The working peasantry and farmers are ruined due to low wholesale prices, as the value of some products of N. (especially grain) has become lower than the cost of their production. World reserves of wheat, including flour converted to grain, on August 1, 1929 amounted to (in million quintals) - 151.5; in 1931 - 166.0. The price of wheat in July 1931 in the USA and Canada was almost 3 times lower than in July 1924. World 'reserves' of sugar grew in 1932 to 2,571 thousand tons; reserves of coffee - to 210 million bags, etc. In view of the complete lack of prospects for improving sales under conditions of the continuing crisis, wheat is burned in locomotive furnaces, and coffee is thrown into the sea by millions of bags by direct order of the Brazilian government - all this is happening under conditions of increasing need and hunger of millions of unemployed masses. The world crisis of capitalism is accompanied and aggravated by a crisis of product exchange and in particular by a crisis of foreign trade in food products due to a whole series of customs barriers, currency crisis, credit crisis, etc. As a result, a number of capitalist countries - Germany, France, USA - are switching to consuming products of their own production, having some products in 'surplus' bordering on economic catastrophe (wheat - in the USA and Canada, coffee - in Brazil, sugar - in Cuba, rye - in Germany).
Livestock products as a general rule have suffered less from the crisis and are less involved in it than grain products, and food products produced in capitalist countries—less than those produced in colonial countries. The crisis in foreign trade is developing on the basis of the decline in the purchasing power of the masses in capitalist countries. World wheat trade. The world export of wheat and wheat flour (net export) amounted to (in millions of bushels): Table 3. 1921/22........
695 The main importers were England, Italy, France, Germany, Holland, and Belgium, which absorbed over 80% of the world's wheat exports. The main exporters were Canada, the United States of North America, Argentina, and Australia. Foreign trade in wheat has been experiencing the severest crisis in the last 3 years. England, France, and Italy are striving to confine themselves to consuming wheat from their colonies and dominions (England), and Germany to its own wheat. Canada, the USA, and Argentina are choking on 'surpluses' of wheat. So-called 'wheat crisis' has in no way affected only the USSR, whose foreign trade continues to develop, and the export of wheat (and other food products) is subordinated to the general tasks of socialist construction and, among other things, to the tasks of improving the nutrition of the working people. Production of food products P. in tsarist Russia and in the USSR. Production of food products P. in capitalist Russia, unlike developed capitalist countries, was at an extremely low technical level, which found expression in extremely low crop yields in agriculture, in the low quality and productivity of livestock, and in the low quality of the products themselves. Systematic crop failures, accompanied by famine of millions of people, systematic 'shortage' of basic food products for millions of peasants even in years of harvest were an expression of the peculiarities of the development of agrarian relations in capitalist Russia, where the predatory type of extensive agriculture was preserved, which made it possible for the state to dump huge quantities of substandard and cheap grain abroad as the basis of a favorable balance, and for landlords and kulaks to obtain profits even at low prices for Russian bread at the expense of the continuous ruin and undernourishment of millions of peasants. - Primitive cultivation of the land, absence or extreme lack of fertilizers, almost complete absence of pest control in the extreme fragmentation of peasant farms were the reasons that under the tsarist regime the gross harvest of grain crops increased only 2 times in 50 years and reached before the war about 60 million tons. At the same time, the export of grain abroad increased 7 times in 50 years and before the war amounted to about 14% of the gross harvest of grain crops (up to 10 million tons). The October revolution radically changed agrarian relations. By eliminating the landlord, it destroyed private ownership of land, destroyed the buying and selling of land, and established the nationalization of land. This led to the easing of the position of the peasantry, which did not need to buy land in order to produce bread. The elimination of the parasitic element in agriculture was reflected in the improvement of the material well-being of the broad masses of the peasantry. Finally, on the basis of collectivization of peasant farms, the kulaks are eliminated as a class, and the peasant masses, united in collective farms, have embarked on the broad road of socialist construction. 'In pre-revolutionary times landlords 'produced' no less than 600 million poods of grain crops; kulaks - 1900 million poods of grain; while the poor and middle peasants produced 2500 million poods of grain. In 1927 kulaks 'produced' only 600 million poods, while the poor and middle peasants - 4 billion poods; This means that the kulaks have weakened more than threefold, and the position of the poor and middle peasant masses has significantly improved. The production result of the change in socio-economic relations in agriculture was that the sown area grew by the end of the first five-year plan by 30 million hectares (including 21 million hectares during the five-year plan), i.e. by 24%, and 6 million horseless peasant farms (poor peasants), entering collective farms, became horse-powered and tractor-powered, and thus twenty million rural population thereby emerged from a state of poverty and destitution' (Yakovlev). The yield of grain crops (grains), equal in pre-war years to about 720 million centners, increased by 1928 to 733 million centners, and in 1932 was about 860 million centners, and instead of 85-100 million centners of commercial grain, which was procured during the period of predominance of individual peasant farming, in the last years of the five-year plan it became possible to procure (centralized procurement) 200-230 million centners. The industrialization of agriculture, the change in the nature of land use, fertilization, the fight against agricultural pests, applied on a mass scale in the social sector of agriculture, increased crop yields. We already in 1930 had an average grain yield of 8 centners per hectare compared to 6.9 centners for wheat, 7.8 centners for rye, 7.3 centners for oats, etc. in 1909-14. However, these achievements are insufficient compared to the possibilities that have opened up with collectivization. The Council of People's Commissars of the USSR and the Central Committee of the All-Union Communist Party (Bolsheviks) in their resolution of 30/IX 1932, stating that 'sown areas in the USSR have grown compared to pre-war by 30 million hectares, especially for technical, row crops and fodder crops, consider that sown areas have been expanded sufficiently, and the goal of the first stage of the rise in agriculture - the greatest expansion of areas - has already been achieved. This means that the time has come when, from the growth of the economy in breadth, by increasing sown areas, it is necessary to turn to the struggle for increasing crop yields as the main and central task in the field of agriculture at the current stage of development. The advantages of large-scale socialist farming give full opportunity to increase crop yields in state farms and collective farms to an extent inaccessible to individual farming'. Increasing crop yields means carrying out measures in a planned manner that will ensure in the shortest possible time such efficiency of land use as will leave behind the developed capitalist countries. 'The Soviet Union from a country of small and smallest farming has turned into a country of the largest farming in the world on the basis of collectivization, the development of state farms and the widespread application of machine technology. This victory of socialism, solving the most important and most difficult task of the proletarian revolution, has world-historical significance' (from the resolution of the XVII Party Conference). Table 4. Size of large-scale agricultural production in various countries. Countries Share of the total sown area in percent USSR (1931), state farms and collective farms (over 100 hectares) ... USA (1925), over 500 acres (approx. 130 hectares) ... Germany (1925), over 100 hectares. 79.0 34.8 21.1 Development of the collective farm movement in the USSR from 1927 to 1932, the rates of development and the share of sown area are presented in the following form: table 5. Dates Number of collective farms Number of farms, members of collective farms 1/VI 1927 . 1/VI 1928 . 1/VI 1929 . May 1930 . 1/VIII 1931 May 1932 . 14 832 33 268 57 045 85 950 217 800 191.7 416.7 1 007.7 5 999.9 13 662.5 %*1 Area of collective sowing 0.8 1. 3.9 23.6 55.1 62.0 758.7 1 388.9 4 185.4 38 385.1 80 138.3 108 000.0 0.7 1.2 3.6 30 9 63.6 41 To the total number of poor and middle peasant farms. *2 To the total sown area (excluding state farms). The resolution of both the grain and livestock problems is taking place on the basis of the socialist reconstruction of agriculture. The Council of People's Commissars of the USSR and the Central Committee of the All-Union Communist Party (Bolsheviks) in their resolution of 31/VII 1931 clearly defined both the tasks in this area and the ways to resolve the livestock problem in the USSR. 'The central task of the near future in the field of agriculture: 1931 and 1932 must be years of such a decisive turn in the development of livestock as 1929 and 1930 were in the matter of organizing socialist grain farming'. The resolution of the livestock problem is going not only along the path of increasing the herd, but also along the path of improving the quality of the herd, along the path of building a meat, dairy and butter industry, building enterprises for the production of compound feeds, along the path of using the latest scientific achievements in biology (the role of endocrine glands), along the path of combating losses and fighting for product quality. The use of waste by the food industry and in the field of public catering plays a major role. The resolution of the vegetable problem goes along the same paths as the grain and meat problems. The socialist sector of agriculture in this area of food production has significant achievements. Table 6. Dynamics of sown area under vegetables (in thousand hectares). Years In state farms In cons. consumer cooperatives In collective farms In individual farms Total 16 140 - ! » 21 317 300 700 805 757 690 832 1144 1 830 The struggle to increase the commercial output of vegetables is being waged not only along the line of expanding sown areas, but mainly by maximizing the increase in crop yields. The task of obtaining high yields is connected with the task of improving the quality of vegetable products. The improvement of the quality of vegetables should be considered both from the point of view of preserving their basic properties during digging, transportation, storage, etc., and from the point of view of expanding the range of vegetable products and solving the problem of supplying the working population with fresh vegetables all year round. This has great hygienic significance. The expansion of sowing early vegetables, the maximum expansion of greenhouse farming - one of the ways to solve this problem.'
The possibility of combining greenhouse cultivation of vegetables and mushrooms (champignons) makes it possible in the shortest time and under very profitable conditions to develop greenhouse cultivation of these and other valuable and useful products. The fruit-berry economy of the USSR is in the most backward state. Here the main issue is not so much in area as in changing the geography of fruits, cultivating new varieties, and developing industry. The work of Michurin (city of Michurinsk) and Moiseev (Altai) proved that in the first case it is possible to advance berries and fruits significantly north of their 'usual' area of growth while simultaneously breeding new varieties, and the work of Moiseev proved that Siberia can have its own apples. An area of up to 500,000 hectares on the coast of Crimea, in Turkestan, and Azerbaijan, now barren, can be used for growing citrus fruits (oranges, etc.). The problem of processing food products, or the development of the food industry, is being resolved on the basis of the development of heavy industry. The resolution of the XVI Congress of the All-Union Communist Party (Bolsheviks) on the development of industry serving the broad masses of P., emphasized in the decisions of the December plenum of the Central Committee and Central Control Commission of the All-Union Communist Party (Bolsheviks) of 1930, as well as the directives given in the address of the Council of People's Commissars of the USSR and the Central Committee of the All-Union Communist Party (Bolsheviks) of 29/IX 1932 on the development of a large-scale food industry and, first and foremost, the organization of a powerful meat and canning industry, basically determine the development of the food industry for the coming years. Implementation of these decisions is proceeding along the line of expanding and better organizing the socialist raw material base, along the line of extensive construction of new enterprises, reconstruction and expansion of old ones, along the line of reconstructing the raw material base in terms of assortment and quality of raw materials. The geographical location, isolation from raw materials or industrial centers, the low technical level, the unsanitary condition of the food industry in fact raised the question of a new industry. The dynamics of the food industry are presented as follows. During the years of the first five-year plan, for the main branches of the food industry of Narcomsnab, 553 enterprises were built: 70 canning factories, 40 refrigerators, 10 meat combines, 5 bacon factories, 6 sugar factories, 10 oil mills, 1 starch-glucose combine, 11 starch-drying factories, 15 egg-poultry combines, 4 dairy factories, 227 mechanized butter-cheese-making factories, 7 margarine factories, 7 confectionery factories, 3 macaroni factories, 32 factory kitchens (in the system of Soyuznarpitga, Parkomsnab), 22 fruit and vegetable processing combines, 74 trawlers, a floating whaling factory, 1 salt works, 7 feed-mixing factories. 'The years 1930-1931 were years of bringing together the scattered food industry into one fist and the beginning of building a real food industry, organized according to the latest technical models'-(Mikoyan). By 1928, 250 million rubles had been invested in the food industry; during the first five-year plan, the total amount of investments amounts to 2 billion rubles. Before the October Revolution, the canning industry existed in the form of small enterprises of artisanal and semi-artisanal type. The total output of the pre-war canning industry amounted to about 80 million standard cans weighing 400.0 z; it served mainly the army and a small part of the urban consumer, supplying him not food preserves but appetizers, mainly of the delicacy type. The processing of fruits and vegetables barely reached 0.75% of the total output (2,375 thousand tons) and fish - 1% (with a catch of 1,150 thousand tons). The growth of the canning industry output in the USSR is presented as follows: if in 1921/22 9 million cans were produced, in 1925/26 - 45.7 million, then in 1929 - 103.8 million, in 1930 - 226.0 million, in 1931 - 600 million. Table 7 (p. 51) shows the shifts in the canning industry by type of product (in thousand cans). The Council of People's Commissars of the USSR and the Central Committee of the All-Union Communist Party (Bolsheviks), giving directives and indicating ways to resolve the meat problem, state that 'the only correct way to resolve the meat problem as quickly as possible is the path of industrializing the entire meat economy, the path of creating a powerful meat industry'. From the point of view of the achievements of modern science and technology in meat production, our country actually had no meat industry. We had (and to a large extent still have) separate scattered enterprises, slaughterhouses, refrigerators, sausage, bacon, meat-canning, fat, gut and other enterprises. All these enterprises were backward, primitive workshops, not connected by unity of technological and production processes, with a very low technical and sanitary level. They were scattered far from each other and subordinated to various, often completely unrelated to meat production, organizations and institutions. The modern meat industry does not know and does not tolerate the separate existence of the enterprises listed above. By the end of 1933, our country must put into operation 57 new enterprises of the meat industry with a total annual output of 15 million tons of meat products - of these 8 large ones, 14 of medium power and 35 combines of small power - in addition 4 small meat combines for processing reindeer. Taking into account that meat supply in 1931/32 will be completely based on the work of existing enterprises, and in 1933 to a large extent still, Soyuzmyaso in 1931/32 reconstructed and expanded 51 existing meat combines. The development of bread baking through the construction of powerful bread factories according to the latest technical achievements is presented as follows. In large industrial centers on 1/1 1932, 224 enterprises with a daily capacity of 9 thousand tons of bread were put into operation. By a government decision of 4/XI 1931, it is planned in 1932 to build 209 enterprises with a daily capacity of 11 thousand tons. With the fulfillment of this plan, the technical base of bread baking in the city will be mechanized by 72%. The October plenum of the Central Committee of the All-Union Communist Party (Bolsheviks) of 1931 decided to complete the mechanization of bread baking in all large cities and industrial centers no later than 1933, and in Moscow, Leningrad, the Urals and the Donbas no later than the end of 1932. Level of nutrition in tsarist Russia and in the USSR and supply. One of the methods for studying the level of P. is the method of income-expenditure records, or budgets of P. The positive side of this method was that it made it possible to reveal the extremely low level of P. of workers and the poorest peasantry, thus providing material exposing the bourgeoisie and characterizing the impoverishment of the working class and the expropriation of the peasantry. Lenin showed a brilliant example of a Marxist study of such budgets. Analyzing the budgets of peasants of the Voronezh province (collected by Shcherbina in 1885-97), Lenin revealed a picture of the P. of separate socio-class groups of peasants (Lenin, 'The Development of Capitalism in Russia', vol. III, ed. 3, 1926). The consumption of products is presented as follows: Table 8. Per 1 capita of both sexes. The same in terms of grain products, a on rye in poods j Meat a 'S 3 a я Groups Й -s 5£ k as5 ф ю пудов ки asSn _ c 1 c к и c н o §э и Итого к o, sn*« >. CD s*c " a н ?.»»> я a 8 S 1** sss « У S a к® ш к . a* ...... 13,12 0,12 1,92 3,49 13,14 18,2 4,2 17,4 0,59 0,32 2,13 3,39 6,31 13,4 3,0 16,4 0,49 19,58 0,27 2,17 5,41 8,30 19,7 3,5 2з 2 1,18 18,85 1,02 - 2,93 1,32 6,43 18,6 4,2 22,8 1,29 20,84 - 2,65 4,57 10,42 20,9 4,2 25,1 1,79 21,90 - 4,91 6,25 . 3,90 22,0 4,2 26,2 1,79 1,21 "a-без лош 18,27 0,35. 2,77 4,05 B-C 2 7,64 лошади 18,4 т, г-c 3,8 3 лош. 22,2 ади, б-c 1 лошадью, 1ДЬМИ, ц-c 4 ! лошадьми, e-c 5 и более лошадьми. 'The distinctive feature of the nutrition of these groups of peasants (we are talking about the horseless and one-horse) is the lack and deterioration of its quality (potatoes). A one-horse peasant eats even worse in some respects than a horseless one. The general 'average' on this issue turns out to be completely fictitious, covering up the inadequate nutrition of the mass of peasants with the satisfactory nutrition of the well-to-do peasantry, which consumes almost one and a half times more agricultural products and three times more meat than the poor. For comparison of other data on peasant nutrition, all products should be taken in terms of their value in rubles. [See Table 9.] So, the general data on peasant nutrition confirm what has been said above. Three groups are clearly distinguished: the lowest (horseless and one-horse), the middle (2-, 3- and 4-horse) and the highest, which eats almost twice as well as the lowest. The general 'average' erases both extreme groups. The monetary expenditure on food turns out to be absolutely and relatively the largest in the two extreme groups: among the rural proletariat and the rural bourgeoisie.'
The first buy more, although they consume less (author's note) than the average peasant, buying the most necessary rural products in which they are in need. The latter buy more because they consume more, especially expanding the consumption of agricultural products" (Lenin). Klepikov, analyzing pre-war budgets of Russian peasants, characterized1 nutrition as bread-potato-milk-based. His conclusions cannot be accepted without criticism, since he omitted the socio-class essence of connections in his work. However, the material has certain value. With his table (Table 10), Klepikov refuted the existence of a single type of nutrition for Russian peasantry and clearly showed that the class differentiation of peasantry determined the type of nutrition of individual socio-economic groups. According to Shingarev's data, peasants in Novo-Zhivotinnoye had a ration amounting to 2,833.7 calories with 97.85 g of protein, 22.12 g of fats, 543.12 g of carbohydrates per capita per day, while in the village of Mokhovatka--91.48 g of protein, 22.49 g of fats, 516.5 g of carbohydrates with a caloric value of 2,703.9. According to Klepikov, on average per capita per day in 16 provinces: proteins - 116.2 g; fats -52.14 g; carbohydrates-581.88 g; in 13 provinces of European Russia: proteins-110.5 g: fats - 49.30 g; carbohydrates-546 g. Compared to similar nutrition indicators of peasants in other countries, the nutrition indicators of peasants in tsarist Russia are the lowest. The budgetary material on nutrition of Russian workers in tsarist Russia is very small. Prof. Erisman ("Food Supply of Workers in Factories of Moscow Province"), characterizing the nutrition of factory workers in Moscow Province roughly in the same years as the above characterization of nutrition of peasants in Voronezh Province, draws the following conclusions: "a) In the food of our workers, both in artels and in family food supply, there is an enormous predominance of nutrients of plant origin over elements of animal origin: 81-82% of all protein and 50-70% of all fat found in the average daily ration of a worker belong to food products from the plant kingdom; ---------------------------! the poorest in animal food are the meals in women's and boys' artels, b) The food of our workers is very rich in indigestible protein substances (26-28% of all proteins), which is explained by the presence of a limited amount of meat products in it, c) Our workers extract more than 75% of all protein and 92-96% of all carbohydrates from black bread and buckwheat groats, d) The food of our workers is poor in taste substances both qualitatively and quantitatively". Kabo provides later data than Prof. Erisman (Table 11-daily nutrition of workers in calories and in main nutrients on average per adult eater). It is difficult and almost impossible to evaluate the presented data from the point of view of physiological norms, from the point of view of rational nutrition. The normalization of food consumption occurred not "from science, but from the political regime". The October revolution fundamentally changed food consumption by the working population. The shifts that occurred in the consumption of food products by the rural population come down to a qualitative improvement in food. This finds its expression: in the replacement of rye bread with wheat bread (541.1 g of rye bread in 1924 and 402.2 g in 1927/28, while the daily norm of wheat bread during this time rose from 157.2 g to 300.5 g); in a significant increase in the consumption of sugar and sugary substances (from 5.8 g per capita per day in 1924 to 15.3 g per day in 1927/28); in the increase in meat products during the same period from 82.6 g per capita per day to 109.5 g per day, in the increase in dairy products from 276.0 g per capita per day in 1927 to 299.8 g in 1928. Grouping budgetary data by income groups of working families allows us to notice internal differences in the nutrition of individual groups of working families, depending not only and not so much on the amount of wages, but on the quality of work of consumer cooperatives, the degree of its coverage of the market of essential products, the degree of involvement of members of the working family in production, etc. Table 12. Consumption of food products per adult eater (in kg) (1921-27) ("Budgets of Workers and Employees", USSR Central Statistical Board, 1929). Groups by monthly expenditure per adult eater in budgetary rubles Product names up to 10 rub. Eggs........ Butter . . . Milk ........ Fish......... Meat ......... Sugar ........ Vegetables .... . . Wheat flour . . Vegetable oil Groats ...... Potato...... Rye flour. . . . 0.028 0.061 1.861 0.555 3.235 0.950 4.116 9.537 0.436 0.860 20.050 11.732 10-15 Rub. 0.050 0.167 4.024 0.800 4.866 1.309 4.877 11.903 0.585 0.558 16.597 8.441 15-20 Rub. 0.129 0.271 5.737 1.076 6.061 1.581 5.530 12.478 0.600 0.629 16.381 8.175 20-25 Rub. 0.200 0.352 6.627 1.110 7.403 1.789 5.948 13.144 0.591 0.636 14.976 7.109 25-30 Rub. VI over 30 rub. VI 0.274 0.829 0.405 0.531 7.737 8.892 1.253 1.487 8.055 9.523 1.857 2.035 6.631 15.186 14.855 0.614 0.529 0.577 0.582 14.731 5.993 6.316 309 165 116 138 112 162 101 123 81 71 77-64 The table of dynamics of nutrition of workers in the USSR (Table 14) and the table of consumption of food products in different worker groups by earnings (Table 12) testify to the improvement in the quality of nutrition of workers in the USSR, which is expressed in the increase in consumption of high-quality products from a biological point of view (milk, eggs, meat, etc.). At the same time, under the conditions of the USSR, different pay for labor is not an obstacle to improving the nutrition level of low-paid groups of workers. Table 13. Consumption - by economic group (with a main expenditure of 15 Product names 1921g. Rye flour . . Wheat flour . Groats ...... Potato..... Vegetables....... Meat........ Fish ......... Milk....... Butter . . . Vegetable oil Eggs........ Sugar ....... 11.919 10.348 2.623 19.018 5.753 4.990 0.690 4.478 0.134 0.627 0.047 1.00 XI- 1925 G. XI- 1926G. 9.533 10.822 2.059 16.707 6.792 5.122 0.682 4.012 0.119 0.567 0.065 1.107 8.441 11.903 1.745 16.597 4.877 4.866 0.800 4.024 0.167 0.585 0.050 1.309 Table 13 confirms the presence of shifts towards improving nutrition in groups with an unchanged budget, and also testifies to the progressive improvement of nutrition even in the lowest income family group. The change in nutrition level, the main shifts in nutrition of workers, peasants and employees in the restoration period are characterized by the following tables 14 and 15 (pp. 57-58). The tables show the dynamics of nutrition over several years-food of workers and peasants in chemical terms. The supply policy in the first five-year plan was based on class differentiation of rations, allocation of workers in large industrial centers and regions (Moscow, Leningrad, Baku, Donbass) into a separate group, as well as1 as strengthened supply of workers in underground, hot shops, shock construction sites. These measures for supplying workers with food are closely related to the task of raising labor productivity, encouraging socialist forms of competition and shock work, as well as measures to combat labor turnover. Supply with food products is carried out along three main lines: a) along the line of centralized state procurement (procurement of grain and livestock products in the form of a tax), b) along the line of decentralized procurement carried out by ZRK, STOLBY, departments by collectives of workers and employees, and finally c) by organizing their own food bases at enterprises (sovkhozes, rabbitries, vegetable and pond farms, dairy farms, pig fattening points, etc.).
A new stage in the organization of food supply was the resolution of the USSR Council of People's Commissars and the Central Committee of the All-Union Communist Party (Bolsheviks) of December 4, 1932, 'On the expansion of the rights of factory administrations in the matter of supplying workers and improving the ration card system,' aimed at better organization of worker supply and at establishing a closer connection between the distribution of food and the interests of production. This resolution designated the most important enterprises of heavy and light industry as a special group. In these factories and plants, instead of the ZRKs being liquidated, factory shops were organized, closed to those not working at the given enterprise. The supply of the first group of large enterprises, in addition to self-procurement, which must be developed in every way, will be carried out through the bases of cooperative and state organizations. The ZRKs of other enterprises, where closed factory shops are not organized, remain within the system of consumer cooperatives, but their activity is subordinated to the factory administrations. Factory administrations are obliged, in carrying out systematic leadership of the work of ZRKs, to provide them, within their budget, material and financial assistance in the better development of trading premises, transport, cooperative farms, vegetable gardens, rabbit breeding, pig breeding, poultry breeding, etc. The great principled and practical significance for the struggle against absenteeism, loafers, and disruptors of production has the improvement of the ration card system. The issuance of ration books for workers and their family members is transferred to factory administrations and is carried out according to payment statements. Public nutrition is the most important link in raising labor productivity, improving the living conditions of workers, emancipating women, and freeing her from the need to spend time and strength on mind-numbing small-scale household management. Lenin pointed to the importance of public nutrition: 'The real emancipation of women, real communism begins only there and when, where and when the mass struggle (led by the proletariat possessing state power) against... small-scale domestic economy begins, or rather, the mass reorganization of it into a large-scale socialist economy.' The changes in the production relations of people introduced by the dictatorship of the proletariat have forcefully raised the question of the socialist reorganization of the household. But for this a material base was needed. Without decisive successes in the industrialization of the country, there could be no question of the possibility of creating such a type of socialist economy. Only in the first five-year plan, especially in the last two years, was the party able to launch a broad-front struggle to switch the food supply of workers from the form of individual household management to public nutrition. The successes of industrialization provided the new large-scale socialist economy, replacing the mind-numbing household, with the necessary equipment and tools, made it possible to proceed to the mass construction of the largest factory kitchens, whose throughput is determined by tens of thousands of meals per day.
Having grown into a powerful industry in food production in recent years, public nutrition has no pre-revolutionary history. At the time of the October Revolution, we had in the largest cities a small number of restaurants, cafes, canteens, 'eating houses' (at inns, in markets, in market districts). Entrepreneurial initiative under these conditions was reduced to presenting low-quality products to the consumer in the most disguised culinary form and avoiding the rare unpleasantness with sanitary supervision at that time. The most valued were those cooks who could skillfully prepare spicy, sour, salty appetizers and dishes that caused 'thirst.' The role of sanitary measures was reduced to issuing some police regulations, to periodic, extremely rare visits by a sanitary doctor, and in the rarest cases to drawing up an act of insanitary condition. During the period of war communism in the USSR, public nutrition originated and developed - not only in cities, not only for adults, but also in villages and for children's groups. The role of public nutrition especially increased in 1921/22, the year of famine. Many human lives were saved thanks to the heroic work of 'Pomgol,' which managed to redistribute and direct scarce food resources to places of greatest need among workers and the poorest peasantry! By the resolution of the Council of Labor and Defense of May 2, 1923, the charter of Narpit was approved. By August 1, 1923, Narpit had opened in Moscow and in the provinces 17 canteens with a capacity of 6,000 meals per day. The growth of enterprises of public nutrition under the control of Narpit is as follows:
Table 14. Dynamics of Worker Nutrition.
Table 18. Indicators of the dynamics of public nutrition. Number of enterprises of public nutrition. Number of meals per day.
Autumn 91.3 91.2 103.0 106.2 113.0 126.1 133.8 129.8 136.4 47.0 43.4 50.9 51.4 45.9 72.6 75.6 72.8 72.3 619.9 3,365 518.0 3,229 652.5 3,571 703.3 3,797 690.9 3,906 698.5 4,056 705.8 4,115 702.7 4,090 723.0 4,196 181 177 181 221 218 221 230 215 223 16.5 16.2 22.1 16.1 30.6 33.9 38.8 37.2 86.6 1.3 2.1 2.5 2.1 3.9 4.3 4.3 4.3 0.7 0.5 0.8 2.1 1.8 2.5 2.5 2.8 1.8 0.5 0.2 0.3 1.3 1.6 3.1 5.9 5.7 103.1 52.8 101.1 51.9 82.6 40.1 103.1 53.5 120.4 67.2 121.0 69.0 131.1 78.4 123.1 73.6 136.1 77.2 717.5 581.1 424.0 685.9 706.7 683.4 689.4 698.9 716.2 3,856 3,320 2,453 3,757 4,016 3,962 4,093 4,060 4,171 213 206 131 261 263 218 246 212 289 15.6 25.6 31.3 11.3 22.8 29.5 37.7 34.4 41.1 1.0 4.1 2.6 1.5 2.9 3.8 4.8 3.9 3.9 2.8 1.6 0.8 5.1 4.3 3.1 3.3 4.1 2.7 0.3 0.5 0.2 0.5 0.8 3.6 4.3 4.3 50 Table 18. Dynamics of public nutrition. Indicators Number of enterprises of public nutrition. Number of meals per day.
The changes in the production relations of people introduced by the dictatorship of the proletariat have forcefully raised the question of the socialist reorganization of the household. But for this a material base was needed. Without decisive successes in the industrialization of the country, there could be no question of the possibility of creating such a type of socialist economy. Only in the first five-year plan, especially in the last two years, was the party able to launch a broad-front struggle to switch the food supply of workers from the form of individual household management to public nutrition. The successes of industrialization provided the new large-scale socialist economy, replacing the mind-numbing household, with the necessary equipment and tools, made it possible to proceed to the mass construction of the largest factory kitchens, whose throughput is determined by tens of thousands of meals per day. Having grown into a powerful industry in food production in recent years, public nutrition has no pre-revolutionary history. At the time of the October Revolution, we had in the largest cities a small number of restaurants, cafes, canteens, 'eating houses' (at inns, in markets, in market districts). Entrepreneurial initiative under these conditions was reduced to presenting low-quality products to the consumer in the most disguised culinary form and avoiding the rare unpleasantness with sanitary supervision at that time. The most valued were those cooks who could skillfully prepare spicy, sour, salty appetizers and dishes that caused 'thirst.' The role of sanitary measures was reduced to issuing some police regulations, to periodic, extremely rare visits by a sanitary doctor, and in the rarest cases to drawing up an act of insanitary condition. During the period of war communism in the USSR, public nutrition originated and developed - not only in cities, not only for adults, but also in villages and for children's groups. The role of public nutrition especially increased in 1921/22, the year of famine. Many human lives were saved thanks to the heroic work of 'Pomgol,' which managed to redistribute and direct scarce food resources to places of greatest need among workers and the poorest peasantry! By the resolution of the Council of Labor and Defense of May 2, 1923, the charter of Narpit was approved. By August 1, 1923, Narpit had opened in Moscow and in the provinces 17 canteens with a capacity of 6,000 meals per day. The growth of enterprises of public nutrition under the control of Narpit is as follows: development of enterprises of public nutrition before the first five-year plan. on 1/VIII on 1/X 1914 on 1/X 1925 17 16,000 121 118,500 281 151 on 1/X 1920 510 364,000 on 1/X 1927 on 1/X 1928 678 434,200 990 610,400 In 1931, as stated in the resolution of the Central Committee of the All-Union Communist Party (Bolsheviks) of August 19, 1931, 5 million workers and 3,800 thousand other workers in cities were covered by public nutrition; 3 million children in schools were served hot breakfasts; the network of public nutrition reached 13,400 units; a significant number of factory kitchens and mechanized canteens were built; in capital construction alone, more than 200 million rubles were invested in the last 3 years. In 1928, in the system of All-Narpit there were only 3 factory kitchens; in 1929 there were 8, in 1930 - 24, in 1931 - 27 and by the beginning of 1932 in the system of All-Coop there were 44 factory kitchens with an average capacity of 30-35 thousand meals per day each. By the end of 1932, the network of factory kitchens expanded to 87. Soyuznarpit launched in 1932 in Moscow the construction of 26 factory kitchens with a total capacity of 400 thousand meals, 7 new factory kitchens have already been put into operation in Moscow. The construction of the first food-processing plant began in Moscow, which will produce 250 thousand meals per day. In the Urals, the construction of 12 factory-preparation plants with a capacity of 442 thousand meals per day began. In the Donbass in 1932, the construction of 35 factory-preparation plants for 640 thousand meals began. The coverage of public nutrition in 1932 is expressed as 42.8%, including 63.2% for workers of special lists, 80% for university students, and 25% for employees. The growth of production of public nutrition enterprises was as follows: Table 17. In million rubles per day 2.5 million . . . 2.8 million . . . 4.0 million . . . 15.0 million . . . 21.0 million . . . 29.0 million On 1/X 1/IV 1/X 1/X 1/I 1/I On December 1, 1932, more than 14 million people were covered by daily meals in public canteens, i.e. 6 times more than planned for the last year according to the 5-year plan. Capital investments in the system of public nutrition. Until 1927, the construction of the public nutrition network was carried out at local expense. During the period from 1924 to 1927, local funds were allocated according to approximate calculations of about 15 million rubles. From 1927, allocations for capital construction of public nutrition are included in the state budget. Allocations by year were as follows: 1929 .....8.5 million 1930 .....29.5 million rubles 1931 . 1932 . . . .64 Table 18. 37 million rubles. Monetary turnover of the public nutrition system. The growth of the monetary turnover of the public nutrition system also testifies to the rapid development of the activity of the public nutrition system. Turnover of the public nutrition system of consumer cooperatives: Table 19. 1927/28 G. . . . 220.3 million rubles 1930 G. . . . 1,010 million rubles 1928/29 G. . . .321.0 million
»
»
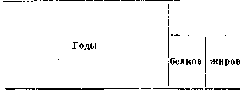
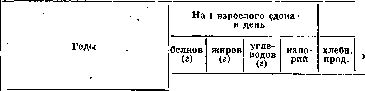
» The basic requirements placed on public Nutrition in the first five-year plan came down to accelerating the pace of socialist construction, assisting industrial enterprises in fulfilling the industrial-financial plan on the basis of raising labor productivity, assisting in reducing worker absenteeism, reducing labor turnover, reducing worker illness, strengthening the involvement of women workers in production, best ensuring the nutrition of workers in leading industries and shock workers, etc., transforming public canteens into one of the most important forms of class distribution of products, transforming canteens in industrial enterprises into nutrition workshops, and thereby quantitatively and qualitatively meeting the demands of the Soviet worker, demands that had grown compared to the previous period. Particularly serious and responsible tasks faced public Nutrition at new construction sites, where to a greater extent than anywhere else, the issues of construction pace, labor turnover, absenteeism, etc., were connected with the quality of organization of public Nutrition and the quality of products. Under the conditions of temporary cultural-domestic service for workers, under the conditions of the struggle for deadlines and quality of construction, public Nutrition was often the only form of satisfying food needs. A series of decisions by the party and government on issues of consumer cooperation, on issues of worker supply, and directly on issues of public Nutrition [resolution of the Council of People's Commissars of the RSFSR of June 26, 1930, December Plenum of the Central Committee of the VKP(b) 1930, appeal of the Council of People's Commissars of the USSR, Central Committee of the VKP(b) and Centrosouz of June 12, 1931, resolution of the Central Committee of the VKP(b) of August 19, 1931, and others] not only drew the attention of the proletarian public to the issues of public Nutrition and created a certain turning point in its improvement, but also introduced a number of fundamental principles into the matter of food supply. The question of the public nature, of its role in ensuring proper organization of Nutrition, received practical resolution through these decisions, which reflected not only on the quality of work of health agencies but also led to new forms of development of this work. The decision to organize closed worker canteens, ZRK, on independent procurement and purchases by ZRK had as its consequence the mass involvement of workers in the organization of their own Nutrition, led to strengthening the class principle in the distribution of food products, to improving the organization of public Nutrition, to transforming the enterprise canteen into a nutrition workshop. Under the conditions of the development of collective farm trade, the main condition for the development of Public Nutrition is the fullest development of its own decentralized procurement of products necessary for canteens and factory kitchens, and the creation of its own food base. The development of food bases is proceeding in the direction of developing fish farming, vegetable gardening, poultry farming, rabbit breeding, mushroom cultivation, dairy farming, breeding of large cattle and pigs, fruit-berry cultivation, etc. These shifts in the very essence of Nutrition organization have given rise to new forms of sanitary work in this area. On the one hand, we have the development of the institute of sanitary food supervision along the lines of the People's Commissariat of Supply, Centrosouz, the development of construction of special institutes and laboratories within these organizations. Such a system allows placing on a scientific basis the issues of sanitary protection of food products in the process of their processing, storage, transportation, etc. The industrialization of the food industry is being carried out along with and in conjunction with the hygienization of production processes. Such an organization of sanitary protection of food products naturally has as its consequence the creation of cadres of specialists—sector sanitary-food doctors, the development of sectoral scientific and scientific-applied institutions. On the other hand, along the lines of health agencies, there has been a restructuring of the form of sanitary work and an improvement in its quality. Instead of sanitary supervision carried out without a plan of specific measures and outside of specific objects, instead of equalization and impersonality, in the service of public Nutrition we have a state sanitary-food inspection working according to a specific plan of sanitary-hygienic measures for a given canteen, for a given ZRK food store, for a given vegetable storage, etc. Qualitatively new, besides the planned nature of the work of the state inspection, is that it in its work relies on the institute of worker sanitary inspection, and through it on the worker active and on the entire worker mass of a given industrial enterprise. The public inspection ensures preferential service of workers in leading industries, ensures the compilation of a specific plan of work for the state inspection (worker proposals), ensures the fulfillment of the plan of measures, since, being attached to individual public Nutrition enterprises, ZRK, food bases, etc., mobilizing and involving the public of these enterprises in sanitary work, putting forward and carrying out proposals of workers of their enterprises (from which they are selected) at production conferences—by all this the worker inspection connects the needs of workers with the production functions of food enterprises, healthifies, hygienizes the processes of preparing meals, food intake, etc. Leadership of the work of the worker inspection is the task of the state inspection, a task based not on turning the worker inspector into an assistant inspector, but on receiving through him assignments (worker proposals), carrying out control functions, implementing the plan. These tasks are connected with raising the sanitary literacy of the worker inspection through evening worker universities, through special (and specialized) courses. Methodological guidance of the worker inspection is a very important factor in the work of the state inspection. The worker inspection is not the only form of worker public involvement in ensuring healthy food for workers. Trade-cooperative sections, deputy groups, etc.—all Soviet public one way or another participates in sanitary measures and in the matter of nutrition. Maximum organizational successes are achieved when health posts of industrial enterprises place their work in the factory canteen at the proper level. Thereby they involve all links of the public, most fully use the competence of the sanitary-food inspection, thereby achieving effective results in improving public Nutrition. The development of self-procurement and the organization of food bases at enterprises have strengthened the role of health posts in this matter, complicated their work and at the same time made the work most fruitful and effective, since food products from the moment of procurement to the intake of ready-made food become the object of direct influence by the health post. Sanitary-hygienic issues are correctly resolved under conditions of sufficient, timely and most complete scientific elaboration of them. This role is performed by the State Nutrition Institute, regional and provincial nutrition institutes, laboratories, medical institutes (corresponding departments of sanitary-prophylactic faculties). The construction of these institutions lags behind the demands of the present day, their work content cannot yet fully satisfy these demands, but we already have enormous achievements in the form of a number of newly arisen institutes, dozens of laboratories, etc. In the socialist sector of agriculture, in collective farms and state farms, public Nutrition developed having the same tasks of raising labor productivity, emancipating women, raising the living standard of collective farmers. In 5,000 state farms and 200,000 collective farms, public Nutrition is winning a firm place alongside strengthening the forms of socialist farming. Similarly, public Nutrition is developing rapidly among organized children. School hot breakfasts and dinners have entered the life of the school, developing and qualitatively improving. The improvement of Nutrition of collective farmers and children is carried out on the basis of organizational and economic strengthening of collective farms, growth of labor productivity, strengthening of labor discipline. Old collective farmers of the Bezenchuksky MTS area in the Middle Volga in their letter to Comrade Stalin thus answer the question 'What did collective farms give peasants': 'Previously, 30% of peasant households were landless, now with rare exceptions every collective farmer has his own cow, pigs, sheep and poultry. This of course not counting what we have on the collective farm farms... Every conscientiously working collective farmer earns 300-350 work-days per year. For a work-day in our collective farms, those working well, 3/4 kilogram of bread comes, in medium ones - 2.5 kilograms, in the worst - 2 kilograms. Thus it turns out that a conscientious collective farmer earns from 6-7 centners to 10-12 centners of bread. Take now a family where two or three people honestly work in the collective farm. Such a family will therefore receive in an average collective farm 120-130 poods of bread' ('Pravda' of January 29, 1933). The problems of nutrition in the second five-year plan are determined by the guidelines given by the XVII party conference. 'On the basis of eliminating parasitic class elements and the general growth of national income, entirely going into the hands of the working people, a significantly faster rise in the well-being of workers and peasant masses must be achieved.'
The Conference considers that the provision of the population with basic consumer goods, and including items of Nutrition, should by the end of the second five-year plan be increased by at least 2-3 times compared to the end of the first five-year plan. "The basic principle of the new, socialist placement of the light industry will be not only its broader development, but also its proximity to raw material areas, i.e., its shift to the east." Sugar factories are being shifted to the east—Kazakhstan, Siberia, Central Asia (including Kirghizia), Transcaucasia, etc. Meat combines—Kazakhstan, Eastern Siberia and other livestock-raising areas. Meat combines will also be built in areas of consumption—in Moscow, Leningrad and other large proletarian centers. Extensive meat-packing and fish-canning plants will be built in the Far Eastern Krai, in Kazakhstan, in the Northern Region, on the Murman coast, etc. Machine-tractor stations will cover all collective farms and will mechanize essentially all field farming. State farms should expand their production and strengthen their role as a model of socialist organization of production and labor, as an example of the application of high machine technology to agriculture, of all the achievements of modern agronomy. The problem of the geographical placement of the food industry cannot be solved without taking into account, regionalizing, and specializing agriculture; it is also solved depending on the shifts in the structure and geography of consumption that should take place with the socialist industrialization; numerous threads ultimately connect this problem with the placement of the main branches of heavy industry, in particular energy centers, which should play a decisive role in transforming the social-economic face of individual districts of the USSR. Such facts as the construction of a second coal and metallurgical base in the east and the transformation of the consuming part of the RSFSR into a producing one lead to the gradual elimination of the customary division into producing and consuming regions, and along with them, the territorial separation of the food industry from places of consumption. The specialization of agriculture is also connected with the specialization along the lines of the food industry. The combination of the food industry creates also a new combination of factors affecting geographical placement. The combination of flour milling with bread baking, with macaroni and biscuit industry, sugar industry—with confectionery and dairy industry (condensed milk), the combination of canning and corn industry and others are urgent problems of the second five-year plan. The use of corn, sorghum and chicory in the sugar industry, of soybeans, cedar and other oil-bearing plants in the oil industry, of wild berries in the fruit-berry industry—push the corresponding branches far beyond the geographical frameworks created by previous historical development and which were fetters to their further growth. Questions about the quality of products of the food industry raise in their entirety the problem of hygiene and sanitation. To make production hygienic means to carry out and fulfill a series of health measures throughout the technical processes of manufacturing a food product, to ensure sanitary conditions so that as a final result a high-quality, standard Nutrition is obtained
duct. It is necessary to ensure production with standard raw materials, to organize warehouse facilities and storage under hygienic conditions, to conduct the technology of processes and their individual elements-operations hygienically in food production, to establish hygienic standards for components (raw materials, spices, provisions, preservatives and other recipe ingredients), and to organize labor, technology, and intra-factory transport hygienically. It is necessary to approach all conditions and objects hygienically. The entire production collective of the enterprise, from director to worker, must know and understand the tasks of hygiene, find their place in this area, and solve these tasks in their daily work. The task of the sanitary inspection is to expand and deepen sanitary-hygienic guidance in all areas of production under these conditions." The total mass of nutrition products produced in the second five-year plan will not only be sufficient to increase consumption by 2-3 times compared to 1932, but the assortment of products will also qualitatively change, i.e., the quality of nutrition itself will change. "With the general growth in consumption of nutrition products, it is particularly important to radically change the structure of nutrition in the direction of its significant improvement by increasing the share in consumption of the most nutritious and most easily assimilated by the human body products. Consumption of such food products as meat, milk, fruits, eggs and others should increase particularly significantly. Approximate calculations of per capita consumption norms in 1937 for individual, most important products of personal consumption allow us to assert that in terms of consumption level, the Soviet Union will be the most advanced country in the world, vividly showing all working people what the working class, building socialism, can achieve" (Kuibyshev, XVII Party Conference). l. Politov. II. Nutrition from a physiological point of view. "Nutrition" as a physiological term denotes the complete supply of the organism (as a whole or in each of its parts, in an organ, in a cell) with such material, through which the phenomenon of assimilation (synonym-anabolism) occurs, i.e., firstly, the restoration of material losses that occurred in the course of dissimilatory processes in the body (see Dissimilation), secondly, the deposition of reserve substances [thesaurization (from the Latinized Greek word thesaurus-warehouse, reserve)] in certain tissues called depot-tissues (e.g., fat in adipose tissues, glycogen in the liver, etc.), thirdly, the formation of new tissues (growth and regeneration). The chapter on Nutrition also includes a circle of questions relating to the characterization of food and its individual components, since they both collectively and individually exert corresponding influence on the completeness of assimilatory processes. With such a concept, it is obvious that Nutrition can satisfy the organism only if the absorbed part of the food is indeed the material through which assimilation could proceed in the corresponding amount. This viewpoint is expressed by Voit (C. Voit) in his definition of the concept of food: "We call food such a mixture of food substances (or means) which maintains the organism in its material composition or brings it to the desired material state." Thus, the quantity and quality of normal Nutrition must be in close connection and direct relation to the needs of the given organism, somewhat exceeding them in the sense that through some parts of the material introduced into the organism, the depot-tissues could be replenished to a certain degree. Nutrition of the organism will be normal when the food, covering all the needs of the body in an adult organism, maintains body weight constancy and proper functioning of the organism, and in a growing organism, in addition, proper body weight gain corresponding to age and normal development of all its tissues and organs. Such Nutrition is contrasted, on the one hand, with Insufficient Nutrition, leading to loss of body weight in adults and to imperfect growth and development in growing organisms, and on the other hand, with Excessive Nutrition, in which there is a significant growth of depot-tissue, mainly adipose tissue, into which part of the food, excessively introduced beyond the needs of the organism, is converted. Physiology of normal Nutrition faces a whole series of problems: problems of caloric value, protein, fats, carbohydrates and mineral components of food; the problem of vitamins; problems of Nutrition during different professional work, during growth, pregnancy, lactation; the problem of Nutrition of the aged organism; the problem of digestibility of food under different conditions of Nutrition; the problem of Nutrition under different climatic conditions; the problem of establishing correct ratios of food substances in order to identify optimal influences of food composition on labor efficiency; the problem of taste in nutrition. However, with the current state of our knowledge about the laws of nutrition, the mentioned problems are not yet sufficiently resolved, and the last two problems have only recently been posed in Soviet physiology. Problem of caloric value. The latent chemical energy of organic substances released in the process of catabolism (see Dissimilation) is converted (directly or through mechanical work) into heat, which leaves the organism either as such (through radiation and conduction) or through vapor formation. This constitutes energy expenditure, which must be covered by its intake in the form of latent chemical energy of absorbed food products. Therefore, to determine the volume of human Nutrition from an energy standpoint, it is necessary to know, on the one hand, the energy expenditure of a person under given living conditions (the method of direct or indirect calorimetry is applied, see Calorimetry) and, on the other hand, the energy evaluation of food, i.e., its calorie content (determined again either by direct calorimetry or by calculation based on the content of assimilable proteins, fats and carbohydrates in food). Determining energy expenditure in humans is a difficult task, far from practically solved. The point is that energy expenditure naturally proceeds parallel to dissimilation, and the latter changes in intensity during the day, having a minimum during sleep and rising during wakefulness to different degrees, depending on changes in the intensity of work, on the influence of food intake and external temperature and other conditions. To determine energy expenditure for a certain period of time in a given state (rest, work, etc.), convenient methods have been developed, based on methods of studying gas exchange; applying these methods to different stages of work and rest during the day, one can approximately determine the energy expenditure of a person per 1 kg of weight per hour for individual states (Table 1). Table 1. Energy expenditure per 1 hour (according to Sherman). Calories per hour Individual states per 1 kg of body weight per person weighing 70 kg Sleep............... Calm lying without sleep........ Sitting at rest........... Reading aloud........ Standing at ease........ Hand sewing........ Standing at attention...... Knitting (23 stitches per 1 min.) Dressing and undressing... Singing.............. Work of a tailor........ Fast work on a typewriter........ Ironing with a five-pound iron........ Washing dishes........ Work of a bookbinder...... "Light" work........ Work of a shoemaker...... Walk (at a speed of 4.5 km per hour)........ Work of a carpenter and metalworker "Medium" work........ Walk (at a speed of 6 km per hour)........ Work of a mason........ "Heavy" work........ Wood chopping........ Swimming........ Running (at a speed of 8 km per hour)........ "Very heavy" work...... Walking (at a speed of 8 km per hour)........ 0.93 1.10 1.43 1.50 1.50 1.59 1.68 1.66-1.69 1.74 1.93 2.00 2.06 2.06 2.43 2.43 2.57 2.86 3.43 4.14 4.28 5.71 6.43 6.86 7.14 8.14 8.57 9.28 65 77 100 105 105 111 115 116 118 122 135 144 144 170 170 180 200 240 290 300 400 450 480 500 570 600 Using such a table, one could calculate, knowing the nature of work and the time budget of a worker, his energy need per day, for example according to the following plan (Table 2). Table 2. Energy expenditure of a metalworker-forge worker (from works of the gas exchange department of the Nutrition Institute in Moscow). State of the subject Hours Sleep........ Prof. work...... Rest...... "Light" work... "Medium" work Total Cal. per 1 kg weight per 1 hour For the entire time on 70 kg body weight 0.93 3.49* 1.31* 2.43 4.14 520.8 1710.1 366.8 680.4 * From data by O. P. Molchanova. The practical application of such calculations is possible only when we have1 a large number of studied cases for each profession, for which is required: 1) accumulation of experimental data on energy expenditure during professional work, 2) precise study of the time budget of workers of the given profession, 3) more precise data on energy expenditure in different states during wakefulness outside professional work, since the information presented in Table 1 is unsatisfactory due to its incompleteness and insufficient detail.
Only by operating with a large number of cases can one cover all the diversity of influences of individuality, age, training, psychological attitude, different specific conditions in the work environment, influences of lifestyle peculiarities, and many others; then all the results of physiological research on calorie intake, which fluctuate due to similar circumstances, will algebraically add up to a stable average that can be practically used. So far, we do not have such a large number of calorie surveys in our hands, as physiologists in Western Europe and America show very little interest in such mass surveys, while in our Union similar works, conducted in a systematic manner, have only recently begun (Institute of Nutrition, department of gas exchange) that it is hardly possible to expect firmly established results in the near future. When physiologists have flawless data obtained on the basis of a relatively large number of surveys, as mentioned above, they will be able to establish caloric norms for food rations for various professional groups of the population. Up to the present time, ration norms have been established mainly only on the basis of statistical budgetary research (see). This method of investigation is based on determining the amount of consumed products over a certain period on the basis of individual records (questionnaires) among selected families or other groupings of persons for observation. From these records, one can calculate the amount of food substances consumed (proteins, fats, carbohydrates, etc.) and the energy contained in them (calorie intake) per 'capita' of the population. In statistical practice, there are several methods for conversion per one adult 'eater'; the most common is the Engel method, which consists in taking the consumption of a newborn as a unit and adding 0.1 for each year of life up to 20 years for women (when it will be 0.1x20+1=3 units) and up to 25 years for men (when it will be 0.1x25+1=3.5 units); thus, a family consisting of persons of different ages receives a number of units equal to the sum of units for each age, and converting the total consumption of this family to 3.5 units gives an idea of the consumption of products by one adult male eater. It is quite clear that such a calculation method can give a large discrepancy with the truth. For example, according to physiological data, we know that a 10-year-old boy weighing about 30 kg consumes 80 calories per 1 kg per day, which amounts to a total expenditure of 80x30=2,400 calories; an adult man, depending on the severity of his work, can actually consume from 2,500 calories (for example, a tailor) to 5,500 calories (for example, a mason) per day; the ratio of energy consumption of an adult and such a child will be expressed by different numbers - from 1 to 2.3, whereas according to the Engel method this number should be equal to 1.7. Without, as noted, physiological data establishing the calorie intake of various professional groups in our hands, we have to provisionally use statistical data for now. On the basis of literary material collected by the Institute of Nutrition Physiology '9 Table 3. Professions Percentage of occurrence Number of rations 1 3-4', '4-5 5-6', '6-7', '12 13 14 15 16 18 B3P°CJ1- Figure 1. Number of calories per kg weight for girls. / historical groups (1-2, 2-3, 3-4, etc. in thousands of calories), i.e., the percentage of 'occurrence' of these caloric groups is indicated. From this table, not only the maximum occurrence of one or another caloric group is seen, but also the degree of distance from this maximum of other caloric groups, which can characterize to a certain extent the specific weight of the obtained maximum. For example, in the group of carpenters, the maximum occurrence falls on the caloric group of 3-4 thousand calories (40.2%), however, the neighboring caloric group also has about 37% occurrence, i.e., if roughly half of the cases have a calorie intake of about 3,500, then more than a third of cases have such at 2,500 calories; such a comparison does not allow using the number 3,500 to characterize this profession, since a solid number of cases have a lower calorie intake, and therefore the characterizing value will be the number 3,000 calories.
The caloric needs of children have been studied more thoroughly and accurately thanks to the classical works of American scientists Benedict and Talbot (Carnegie Institute) and a whole series of others. Here we will present graphs (Holt, Fales), from which it is easy to calculate the calorie intake of N. children at different ages. When compiling these tables, the addition in energy demand caused by growth, the influence of food and the mobility of children (Figs. 1 and 2) was taken into account. (Rounded numbers illustrating the energy needs of children of different ages are given in Table 4, compiled by Lucy Jellett (L. Jellett) on the basis of her observations of the nutrition of 223 children. 1\ Table 4. Daily calories. Age Boys Girls Below 2 years 1,000-1,200 980-1,210 2-3 1,100-1,300 980-1,280 4 1,100-1,400 1,060-1,360 4-5 1,200-1,500 1,140-1,440 5-6 1,300-1,600 1,240-1,520 6-7 1,400-1,700 1,300-1,600 7-8 1,500-1,800 1,380-1,680 8-9 1,600-1,900 1,460-1,760 9-10 1,700-2,000 1,550-1,850 10-11 1,900-2,200 1,650-1,950 11-12 2,100-2,400 1,750-2,050 12-13 2,300-2,700 1,850-2,150 13-14 2,500-2,900 1,950-2,250 14-15 2,600-3,100 2,050-2,350 15-16 2,700-3,300 2,150-2,450 16-17 2,700-3,400 2,250-2,550 It should be noted that the rather sharp differences shown in the table for girls and boys are probably caused not only by physiological reasons but also by the education system, which creates in America a less mobile lifestyle for girls. The education of children practiced in our Union in this respect probably causes significantly smaller differences in energy needs between different sexes; therefore, the numbers given for girls should be increased. However, this question requires experimental verification.
For a rougher calculation of caloric needs in children, Sherman gives the following table: Table 5. Age (in years) Below 1 year 1-2 3-5 6-9 Calories per 1 kg per day 90-80 80-70 Age (in years) 10-13 14-17 18-25 Calories per 1 kg per day 75-65 65-50 50-40 The protein problem in nutrition. If according to the actual energy expenditure in the body we can with full right judge the necessary energy content in food, then such a simple solution cannot be applied to the question of food protein. The amount of protein broken down (used) in the body cannot be an absolute measure for determining its proper amount in food (see Metabolism), since the breakdown of protein in the body within certain limits is a function of the size of the labile protein mass in the body; the larger the latter, the faster and more protein breaks down in the body and the more food protein is needed to maintain the body in nitrogen balance. Thus, the question of the protein 'norm' for a person is related to the size of his protein reserves, and since more than half of these reserves are in the muscles, it can be said that the more developed the muscular system, the more protein is needed in food to maintain nitrogen balance at a given level. On the other hand, it is known that nitrogen balance can be established in the body at different levels of N intake and within rather wide limits; therefore, the presence of nitrogen balance does not yet solve the question of adequate protein supply of the body; from the physiological literature it is known that a person can more or less long maintain nitrogen balance (provided the food is rich in carbohydrates) with an extremely low level of nitrogen in it. Thus, according to data reported by Caspari, a certain N., weighing 40 kg, who was fed fruits, acquired a state very close to nitrogen balance even with 2 g N in the daily food (the nitrogen balance gave fluctuations from -0.13 to +0.11 g during a certain period of observation). Voit proposed a protein norm for a person with average work (on 3,000 calories per day) of 118 g protein; this norm has been criticized, and other authors have proposed different figures (see Metabolism-protein metabolism, nitrogen balance).
Intensive protein diets for people engaged in heavy muscular labor are justified by the fact that a necessarily large amount of food (in accordance with caloric requirements) would lose significantly in its taste properties if this food were poor in protein; increasing the protein portion means introducing animal products (meat and dairy) into the diet, which improves digestibility, gives the food incomparably higher organoleptic qualities, and also facilitates for the cook the composition of a more varied menu in public nutrition. In addition to the total amount of protein, when establishing protein norms, attention should be paid to the quality of the protein (see Metabolism, nitrogen balance). Voit believed that animal protein should constitute one-third of the protein portion of his diet. Unfortunately, we have very little or, rather, almost no information on the amino acid composition of food products (for example, eggs, meat, wheat, etc.); our usual information refers to the amino acid composition of individual protein preparations obtained from some food source. The table 6 attached here gives an idea of the amino acid composition of such preparations. The significance of individual amino acids can be illustrated by experiments on rapidly growing animals (rats), which receive one or another protein preparation, or a combination of them, or a combination of preparations with individual amino acids as their protein material. Thus, for example, zein, a protein from corn, contains neither lysine nor tryptophan; its use as a protein material in the diet cannot even maintain the animal's weight, the addition of any one of the missing amino acids (tryptophan or lysine) prevents weight loss, but cannot ensure the animal's growth, whereas the addition of both amino acids restores normal growth (see Metabolism, protein metabolism, fig. 4). On the basis of such experiments, it has been established that proteins, according to their amino acid composition, can be divided into groups of complete and incomplete proteins, and accordingly their natural carriers receive a corresponding characterization, as is evident from table 7 (according to Rose). However, it should be remembered that even complete proteins, taken in insufficient quantities, may manifest themselves as incomplete proteins, as can be seen from the following example (fig. 3): rats on a diet with 18% casein grow normally; if the content of this protein is reduced to 9%, growth is twice as slow, whereas the addition of cystine restores the growth rate to normal. Thus, a decrease in the amount of casein made the diet insufficient in terms of cystine, the addition of which brought correlation into the diet. From this it follows that complete proteins, in order to manifest their completeness, must be present in the diet not below a certain level, and on the other hand, a suitable mixture of different proteins can correct the deficiency caused by a low level of complete protein in the diet. Thus, the complete protein lactalbumin does not give normal growth at a content of 4.5% in the diet; when 13.5% zein is added to the same diet (total protein content 18%), growth proceeds normally.
Table 6. Amino acid composition (in %) of proteins (according to Sherman). Amino acids Albumins Glycine Alanine Valine Leucine Proline Hydroxyproline Phenylalanine Aspartic acid Glutamic acid Hydroxyglutamic acid Serine Tyrosine Cystine Arginine Histidine Lysine Tryptophan Ammonia Total egg albumin 0.00 2.22 2.50 10.71 3.56 5.07 2.20 9.10 1.77 2.13 4.91 1.71 3.76 3.64 1.31 51.62 pKT- , Leu-albu-melin Globulins edestin from soybeans I i 3.8j j
; 0.8Э
' 4,(5
- 0.15
0.21
', 5.95
4.-23
4.99 1.97 0.91 23.42 1.80 0.74 4.50 1.ao 4.72 1.76 1.92 1.80 4.01 05.31 1.74 0.63 12.72 3.78 7.C6 3.C0 2.93 + . 2.21 45.53 0.CO 0.00 2.00 0.43 3.31 6.62 .13.22 2.35 0.58 43.66 2.40 0.13 3.5У 2.32 3.11 3.35 0.92 1.14 5.22 93.89 0.13 5.67 13.73 5.03 43.20 1.67 1.55 2.89 2.11 1.01 1.C5 4.81 83.31 0.13 0.00 1.33 13.39 1.88 6.30 19.55 9.82 9.01 2.70 6.55 0.55 1.eo 38.C5- 26.17 -- 2.50 0.06 1.02 1.19 3.55 0.85 2.22 1.82 0.£9 0.82 0.C0 + 0.00 5.11 3.61 67.55 92.58 25.50 8.70 1.00 f 7.10 9.50. 11.10 1.40 3.50 5.80 0.00 0.40 (0.01?) (0.31?) 8.22 ' 0.90 5.92 0.00 0.49 92.85 0.45 1.85 7.93 9.70 7.63 0.23 3.E8 4.10 21.77 10.50 .0.50 6.50 0.50 3.81 2.84 7.62 2.20 1.61 93.62 OVOBI-tellinin from chicken egg . 0.00 0.75 1.87 9.87 4.18 2.51 2.13 12.95 3.37 0.83 7.46 1.90 -4.81 2.42 1.25 56.33 7S
Table 7. Food material Main protein substances Physiological characteristic Milk < Cheese } Egg i Meat -J:. Wheat 1 Soybeans t Corn ' Peas Beans Gelatin Casein Albumin Casein Albumin Egg albumin Ovotellin Albumin Myosin Gliadin Glutenin Glycinin Legumin Glutenin Zein ) D Legumin Phaseolin Gelatin < Complete Complete » Complete » Complete < » Lacks lysine Complete Complete Incomplete Complete Lacks lysine and tryptophan; incomplete Incomplete Incomplete Lacks tryptophan, tyrosine, cystine (traces ?); incomplete
Figure 3.
Figure 4.
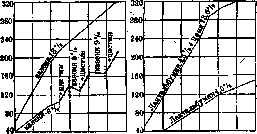
Figure 3. Growth of rats on casein (18% diet) and the same with 13% casein with and without the addition of cystine. Figure 4. Growth of rats on a diet with 4.5% lactalbumin and the same with the introduction of 13.5% wheat gluten; in this case, the quantitative deficiency of amino acid components of lactalbumin was replenished by components of wheat gluten, taken in larger quantities, which as a result gave a combination satisfying the organism (quantitatively and qualitatively). From this follows an important practical conclusion - the mandatory diversity of proteins in the human daily diet, achieved by introducing into the daily menu the largest possible number of different protein-containing products. This is advantageous because with the diversity of proteins in food we can somewhat reduce the content of high-value protein carriers, replacing part of them with a combination of less valuable ones (similar to what was done in the experiment just described). Thus, in the diet, it is sufficient to have one-third of the total protein mass as complete proteins of animal origin (fig. 3 and 4). The problem of fat in nutrition. On the nutritional value of fat-see Fats. Many consider the fat components of food simply as carriers of 'concentrated' energy (heat of combustion of fat-9.1 cal., proteins and carbohydrates-4.1 cal.), and therefore it is often permissible to increase the carbohydrate components of food 'at the expense of fats' (according to isodynamic calculation). Some considerations seem to defend such a practice. Thus, according to experiments by Osborne and Mendel (1920), rats receiving only traces of fat in their food grew normally and were as well-nourished as the controls receiving large amounts of fat. Farm animals, as is known, tolerate a very low fat norm in their diets without disturbance of vital functions; the accumulation of fat in their bodies goes entirely at the expense of non-fat parts of food (mainly carbohydrates). In addition, it is pointed out that a person quickly gets used to consuming very large amounts of carbohydrates, and on the other hand, carbohydrate food is significantly cheaper. However, a number of circumstances speak against too significant reductions in the human fat ration. Fat-free diets are inevitably more voluminous, which burdens the intestine and reduces the assimilation of food. The presence of fat, as is known, gives a more noticeable feeling of satiety, probably due to the longer stay (under the influence of fat) of food in the stomach. Moreover, a low level of fat in the diet makes it significantly less tasty, quickly becomes boring and stops stimulating the appetite. Often, prolonged absence of fat in food causes aversion to it, even in the presence of a general feeling of hunger. In addition, fats are carriers of lipoids (see Metabolism-fat metabolism). On the other hand, food fats, having significant chemical inertness, can quickly pass into depots without undergoing intermediate metabolism processes, and thereby increase the reserve of potential energy in the body. True, fat for this purpose can also be obtained from other organic substances in food-carbohydrates and proteins,-however, for this synthesis, the latter substances must go through a complex path and lose some, although, it is true, small, of their inherent energy. As energy carriers, fats show no differences depending on their origin from plant or animal food sources, but in terms of digestibility, it is noted that vegetable fats (oils), as well as milk fat, margarine and low-melting animal fats, are equally well digested. High-melting fats of some animal species, for example, mutton fat, are inferior to them in this respect. However, in the question of fat digestion, the amount of fat in food plays a large role; with very fatty food, any fat is digested much worse. As for the amount of fat in food, then for all the reasons given, attention should be paid to the human fat ration (see Fats). Carbohydrates supplement the caloric value of the human diet after proteins and fats. Most people are not used to consuming large amounts of fat, and carbohydrates make up a significant percentage (by calories 60-70%) in all food rations. In residents of the far north (for example, Eskimos), carbohydrate consumption is insignificant due to the nature of their N. (consumption exclusively of animal food); conversely, residents of hot and temperate zones, feeding mainly on plant food, consume large amounts of carbohydrates. Carbohydrates are taken by man mainly in the form of starch. The slow digestion of the latter creates conditions for the gradual penetration into the blood of the product of its enzymatic breakdown-glucose, thanks to which the glycogenic function of the liver is performed without strain despite the significant consumption of starch during the day. On the contrary, the consumption of large amounts of sugar, due to the speed of its absorption, can overload the barrier function of the liver and cause alimentary glycosuria. In addition to starch, man consumes a certain amount of sugar per se (sucrose) or in the form of sugar products and sweet natural products (sweet fruits), where in addition to sucrose we encounter other sugars-glucose, maltose, etc. In milk, man consumes lactose, while in honey-inverted sugar (mainly) with an admixture of sucrose and other organic compounds. The consumption of sweet products, dishes and sugar per se has a certain hygienic significance, as it enhances the pleasant taste of food and expands the boundaries of various combinations in food preparation. The enormous consumption of sugar by man indicates the acquired importance of this product in food regimes. If the body consumes more food substances than is necessary for its needs, then the excess of absorbed substances passes into the corresponding depots, or is thesaurized (see above): fat is deposited in adipose tissues (omentum, perimysium of muscles, subcutaneous tissue, etc.); carbohydrates-in the liver and in muscles in the form of glycogen (however, a small amount of the latter is also found in other tissues); protein depots are mainly muscles, then the liver and probably other tissues; mineral depots-bones, as well as other tissues, for example, muscles, as they, increasing the mass of organic materials in the order of assimilation, are forced to take the corresponding amount of various mineral elements. However, all depot tissues, except adipose tissue, are relatively low-capacity and are quite quickly filled with the deposited material. Upon the advent of such a moment in relation to mineral elements, the excess of the latter will simply be excreted from the body by the corresponding excretory organs (kidneys, lower part of the intestine, etc.), while proteins and carbohydrates will be converted into fat. That such a transformation actually takes place was irrefutably proven at the time by physiological experiment (Cremer, Bogdanov, etc.) as well as by livestock practice [fattening on fat by means of protein food (for example, casein) or carbohydrates]. Carbohydrates also include cellulose of plant tissues. It is usually not considered a food substance, since it is not subjected to digestion in the intestine. However, under the influence of part of the intestinal flora (mainly Bac. cellulosae dissolvens), cellulose ferments (methane fermentation), as a result of which gases (CH4, H2 and CO2) and a number of organic acids (acetic, butyric, lactic, etc.) are obtained, which are absorbed as food substances (energy carriers). In herbivores, this process proceeds on a large scale and has practical significance for N. In humans, cellulose fermentation is generally small and is not taken into account in N. However, it should be said that a number of vegetables and fruits, passing through the intestine, lose a significant amount of their cellulose: potato-76.5%, carrot-66.2%, grape-42.8%, different beetroot-82-84%, cabbage and celery-55.8%, mixed plant food-75% (Koenig). If during cellulose fermentation not all carbon and hydrogen pass into gases, but soluble organic substances are also obtained (see above), then such a decrease in cellulose in the intestine can be attributed (to some extent) to the act of digestion. The group of cellulose also includes bodies called hemicellulose, which are widely found in the plant world. They are able to swell in water and together with cellulose act on the intestinal wall, stimulating peristalsis; therefore, the presence of cellulose and hemicellulose in food has great hygienic importance. A representative of hemicellulose is agar-agar, the use of which as a laxative is well known. The cellulose of vegetables and fruits, unlike that of grain products, does not cause sharp irritation when acting on the intestine and can be consumed with benefit in large quantities. The problem of mineral nutrition. Losses of mineral elements through sweat, tear secretions, feces, urine, secretions of the nasal mucosa, secretions of the genital organs, etc., must be replenished by food. The presence of mineral depots (skeleton, etc.) ensures a normal level of mineral elements in the blood even with very significant fluctuations in their content in food.
Determining human requirements for various mineral elements was the task of special research by many authors. It was found that the magnitude of this requirement can be influenced by a number of circumstances, so that losses of each individual element by the body are not always constant; besides the absolute content of mineral elements in food, the ratio of these elements to each other, the presence or absence of vitamins, the amount of water consumed, and a number of other factors—such as work, age, etc., the study of which has been conducted, so to speak, only as a first approximation—have great importance. Therefore, we must consider that the requirement for mineral elements established by American physiologists (Sherman and others) concerns only three elements (Ca, P, and Fe) and is actually only provisional (see Metabolism—mineral metabolism). When compiling food rations and evaluating them from the standpoint of mineral composition, we encounter very great difficulty in that we do not have strictly established data on the mineral composition of our foodstuffs and almost entirely lack data on the mineral composition of their assimilable part. Literary data (and moreover foreign data) do not present a uniform picture, and using different sources, one can obtain very different results in characterizing a ration. This circumstance was "emphasized at the time by the Institute of Nutrition Physiology in Moscow, where material was collected illustrating significant fluctuations in the figures given by different authors for the same product. Thus, for example, in rye flour we have according to Sherman 18, according to Berg—13, 8 according to König—3 mg% (i.e., per 100 g of original product); for buckwheat flour the same sources give: Fe-1.2-14-19, Mg-48-88-116 mg%. It is quite obvious that for the USSR a specially compiled table of the mineral composition of domestic products is necessary, so that physicians monitoring the quality of nutrition can use suitable material for judging the amount of mineral elements consumed in a given menu. In the absence of such a table, it is more correct for now to use the data of Sherman (USA), who has done much work on mineral metabolism and had at his disposal extensive material. According to Sherman's data, the requirement of an adult human for Ca is 0.68 g, for P is 1.32 g, for Fe is 15 mg per day, which per 1 kg of body weight per day amounts to respectively 9.7; 17.4; 0.2 mg. German hygienists (König) give different figures: Ca-1.0-1.5 g, P-0.84-1.29 g, Fe-20-30 mg. Studies of American rations gave the following fluctuations (per 1 person per day in g): Ca Mg Na Maximal: 0.51 2.82 1.28 Minimal: 0.24 1.87 0.73 Fe Maximal: 0.14 0.67 0.34 Minimal: 0.0080 0.0370 0.0173 When evaluating human food rations, attention should be paid to Ca, P, and Fe, since a deficiency of these elements can manifest itself most quickly. The products richest in calcium are the following (in mg per 100 g of original product): cheese-931, common walnut-287, dry beans-160, egg yolk-137, cauliflower-123 and milk-120 mg (fluctuations of Ca from 931 to 120 mg, i.e., from 1.4 to 0.2 of the daily dose). The products richest in phosphorus are: cheese-683, egg yolk-524, whole wheat-423, dry peas-400, oat flour-392, walnut-354, buckwheat-327, corn-283, buckwheat flour-226, meat-215, whole egg-180, bread from whole grain (wheat)-175, rye bread-148 mg (fluctuations of P from 683 to 148 mg, i.e., from 0.5 to 0.1 of the daily dose). The products richest in iron are: lentils;-8.6, egg yolk-8.6, dry beans-7.0, dry peas-5.7, walnut-4.1, spinach-3.6, lean meat-3.0, egg-3.0, whole wheat flour-2.5 mg (fluctuations of iron from 8.6 to 2.5 mg, i.e., from 0.6 to 0.17 of the daily dose). The products richest in sulfur are: lentils-227, cheese-263, lean meat-230, dry peas-219, dry beans-215, dry peaches-212, oat flour-202, barley groats-120, walnut-198 mg (fluctuations of sulfur from 277 to 198 mg, i.e., from 0.2 to 0.15 of the daily dose, if the latter is taken as 1.3 g). The products richest in magnesium are: buckwheat-167, dry beans-156, peas-149, walnut-140, corn-121, oat flour-110, lentils-101 mg (fluctuations of magnesium from 167 to 101 mg, i.e., from 0.5 to 0.3 of the daily dose, if the latter is taken as 340 mg). The products richest in potassium are: dry beans-1,229, dried plum-1,030, dry peas-903, lentils-877, raisins-820, spinach-774, walnut-618, rye flour-465, potato-429 mg (fluctuations of potassium from 1,229 to 429 mg, i.e., from 0.4 to 0.1 of the daily dose, if the latter is taken as 3,390 mg). Among bioelements that have great importance but whose content in the human body and food is very small, the halogens—iodine and fluorine (J, F)—occupy first place in importance. The latter is a necessary component of bones and teeth, while the former is concentrated mainly in the thyroid gland (see Iodine). Prolonged absence of iodine in food or possibly prolonged consumption of food with very low content of this element causes great complications in the function of the thyroid gland, externally expressed as an increase in its size (simple goiter) "(see Goiter). Table 9. Iodine content in food products (in mg per 1 ton of dry product) (according to Sherman). Areas without endemic goiter Products Iodine content Wheat .... Wheat .... Oats...... 3.5 Carrot . . . Salmon .... Salmon .... 1.5 Salmon .... Salmon .... Goat milk Areas with endemic goiter Products Wheat . . . . Wheat . . . Oats ...... Bran ..... Spinach . . . Carrot . . . Apples . . . . Pears..... Butter . . . . Skim milk
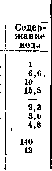
The role of vitamins in human nutrition is still little understood despite the relevance of the topic and the enormous abundance of work in this field. It has long been established that humans are susceptible to all types of avitaminoses, and the latter can be not only in the form of acute, well-studied, so-called classical forms, but also in the form of chronically occurring diseases or even in the form of a long-lasting latent phase, manifesting itself with very unclear symptoms, which can be diagnosed with certainty as avitaminoses only after successful therapy with the corresponding vitamin. Based on the clinical data of experimental animals, we can say that such a hidden state is the result not of a complete absence of vitamins in food, but only of a decrease in their content below a certain level of minimal requirement. If pathological conditions caused by the complete absence of vitamins are called avitaminoses, then the consequences of prolonged reduced vitamin intake we call hypovitaminosis.
Before us, therefore, at the present time stand two most important practical questions: 1) determination of the quantitative human need for vitamins, 2) quantitative evaluation of various foodstuffs as vitamin carriers. For the solution of the latter question, we now possess sufficiently well-developed methods allowing more or less precise quantitative determination of vitamin content in foodstuffs; as for the human need for this or that vitamin, the quantitative aspect of the question is still far from its resolution. Vitamin A, so-called anti-xerophthalmic vitamin, belonging by its chemical nature to sterols, is comparatively easily oxidized, especially with access of O2 under conditions of heating. Its absence see Avitaminoses, A-avitaminosis. The question of comparison of vitamin activity of different foodstuffs has been developed quite satisfactorily by a special technique. It amounts to the following: young healthy rats of one month of age are fed food not containing vitamin A, but complete in all other respects; they are arranged in groups so that in each group there are 1-2 animals of the same litter. A certain dose of the product being studied is introduced into the food mixture of each group with the aim of establishing at what dose the influence of vitamin A will be manifested in such a way that the increase will be approximately equal to 3 g per week; the dose giving such an effect is considered to contain one unit of vitamin A. Then it is easy to calculate how many such units are contained in 1 kg of product. In table 10 a number of common products receives thus a corresponding evaluation according to vitamin A content. Table 10. Number of units of vitamin A per 1 kg of product. White wheat flour ... Whole milk ... Beans (green pods) ... Beef fat ... Green peas ... Tomato (raw and canned) ... Celery (green leaf) ... Butter ... Carrot ... Cheese (hard variety) ... Fresh spinach ... Egg yolk ... Eggs ... Egg white ... Fish oil (cod) ... Lemon ... Beet ... Boiled potato ... Olive oil ... Beans (canned) ... Apples ... Raw lean meat ... New raw or cooked cabbage ... Same stored ... 188 Same colored ... Grape ... 550-770 Orange juice ... Lettuce ... 1650-6600 o 2 200 3 520 5 500 5 500-7 700 5 940 6 600 17 600-48 400 22 000-66 000 22 000 55 000 59 400 19 800 0 176 000 and more It is easy to imagine that if fish oil is prescribed to children at 10 g per day, which is approximately about 2 000 units, then the same amount of carrot will be 30-100 g (variations probably depend on the variety and degree of storage, and perhaps on the soil regime of the plant). However, such calculations require very great caution, since samples of fish oil have very different activity, and a standard for this product (mandatory for the pharmacopoeia of some countries) has been developed only recently. Vegetable oils (like olive oil) have a negligible content of vitamin A. With low content of A-vitamin in food, a condition of hemeralopia (night blindness) may occur in humans, which must be regarded as a manifestation of hypovitaminosis A. It was often observed among prisoners (in concentration camps), during long sea voyages, among coolies and soldiers of China, India and Japan; during the world war the disease was widespread in Romania among children, in Vienna, etc. In all the mentioned cases, the appearance of hemeralopia was due to the low fat content in food, as well as dairy products and some vegetables. The influence of vitamin A on the growth and well-being of the organism is illustrated by experiments from which it is seen that following an increase in the dose of vitamin carrier there is also an increase in the effect of its action. This allows us to draw a practical conclusion about the desirability, especially in children's nutrition, of a higher level of vitamin A. It should be remembered that vitamin A is capable of being deposited in the tissues (especially in fat) of the organism, and therefore it is necessary to urgently recommend that pregnant women consume a larger quantity of food products rich in this vitamin, so as to raise its content in the mother's body and the fetus, thereby ensuring the successful development of the new organism before and partly after birth. For vitamin A to be transmitted through milk, it must be present in the mother's food in some excess; observations show that with certain insufficiently high levels of vitamin A in the mother's food, newborns using her milk gradually developed avitaminosis A, while the mother herself was quite healthy in this respect. That the content of vitamin A in milk depends entirely on food is evident from research on cow's milk for vitamin A: summer milk from cows receiving fresh pasture feed has much vitamin A, while on dry feeds in winter time, vitamin A may be completely absent. Vitamins of group B* although comparatively well studied, however the question of the magnitude of human need for them is very little developed. At present, it is also necessary to revise old data concerning the content of vitamins of this group in foodstuffs, since previously the comparison of activity of some vitamin carrier was made by observations on the growth of young animals (rats) at different doses of this vitamin carrier. That amount of vitamin was taken as a unit which is contained in the dose of food maintaining the weight of a standard animal (starting from one month of age) at the same level for 8 weeks. Obviously, with such a technique, the experiment was conducted with vitamin G (B2), while the content of other vitamins of this group was not checked here, whereas the concentration of each of them in various vitamin carriers is by no means the same, i.e., determination of one component of the group does not indicate the content of another. Thus, for example, chicken white does not possess anti-neuritic property (no B1 or F), but is rich in anti-beriberi vitamin (B2 or G). In individual cases, vitamins B2 and B3 may be present simultaneously in large quantities, for example in baker's and brewer's yeast. Table 11. Number of units of vitamin B (probably more precisely B2) per 1 g of product (according to Sherian). Onion ... 220 Lettuce ... 330-440 Potato ... 286 Cabbage ... 330-660 Apple ... 220-352 Egg ... 1320 Orange juice ... 330 Egg yolk ... 1760 Green beans ...
Table 11. Number of units of vitamin B (probably more precisely B2) per 1 g of product (according to Sherian). Onion ... 220 Lettuce ... 330-440 Potato ... 286 Cabbage ... 330-660 Apple ... 220-352 Egg ... 1320 Orange juice ... 330 Egg yolk ... 1760 Green beans ...
From the table it is evident that the strongest vitamin carriers are grains (whole) of cereals and legumes. It should be added that the yeasts (baker's and brewer's), not mentioned in the table, have even greater activity and in relation to vitamin B, surpassing cereals or legumes 10 times, and cereal embryos are even more active; thus, rice embryos are stronger than yeasts by 2-3 times. Obviously, to supply a person with vitamins of this group, one must mainly base oneself on grain products. It should be remembered that in wheat or rice, vitamin B is concentrated in the bran and embryo, therefore flour prepared with a high percentage of extraction, as well as polished rice, may completely lack vitamins; on the other hand, rye has vitamin B scattered in some quantity throughout the entire grain mass. Vitamin B is quite stable and during ordinary culinary processes involving heating, it is lost to a small extent. The prevalence of vitamins of this group in human foodstuffs makes the fight against B-avitaminoses (in a cumulative sense) relatively easy; pellagra or polyneuritis (beri-beri) occur comparatively rarely, only under particularly unfavorable circumstances (one-sided nutrition with foodstuffs poor in the corresponding vitamins for a long time). Anorexia as some symptom of hypovitaminosis has been well traced by a number of authors in experimental animals (rats, dogs). The appearance of furunculosis (successful therapy with yeasts) is also attributed to a deficiency of vitamin B. Thus, when compiling rations, attention should be paid to the menu having as much variety as possible; this can be achieved thanks to the cumulative effect of various vitamin carriers to fully satisfy the need for all vitamins of this group.
Vitamin C, the absence of which causes scurvy, was studied later than others in a chemical aspect, however, it was possible to determine the probable human need for it, namely, it can be considered that this need is 16-20 times greater than the need of the guinea pig (standard experimental animal). As a unit of vitamin C, they consider that amount which is contained in a dose of some vitamin carrier, just sufficient (minimal preventive dose) to prevent the development of scurvy in a guinea pig within a period of 100 days on a scorbutic diet (control animals on this diet alone die of scurvy within a month).
Table 12. Number of units of vitamin C in 100 g of various products.
Table 13. Number of units of vitamin A in 100 g of various products.
Watermelon ...................... 190 Fresh cherry............... more than 150 g Data marked with an asterisk are from Sherman, the rest are from the works of the Institute of Nutrition Physiology and the Vitamin Department of the Institute of Public Nutrition (Moscow). As in the case of other vitamins, if the content of vitamin C in food is below the minimum requirement, states of hypovitaminosis may manifest in the form of initial scurvy symptoms - slight fatigue, paleness of the skin, slight swelling of the gums, slightly loose and sometimes bleeding, intestinal disorders, sensation of pain in the lower extremities, particularly in the knee joint, etc. All these are phenomena that can easily be attributed to quite different diseases. Comby (1921) states that out of 72 cases of scurvy (prescorbutus, latent form) he encountered in children, 90% were incorrectly diagnosed by the attending physicians. - The prescorbutic state - hypovitaminosis C - in adults is also difficult to diagnose. Often due to the patient's complaints of pain in the joints, treatment for rheumatism is undertaken. In this state, a person significantly loses their capacity for work, as an aversion to labor appears, a depressed state of mind, indifference to the surroundings, etc. At the same time, the body's resistance to infections is significantly weakened. All this taken together forces us to consider hypovitaminosis C, given its prevalence (epidemic, endemic), a serious disaster. It is quite obvious that the only useful measure, both preventive and therapeutic, is the consumption of vitamin carriers in such quantity as corresponds to their antiscorbutic activity. The probable preventive dose of vitamin C for a person, according to what has been said, is 16-20 units per day. Vitamin D' - see Vitamins, Avitaminoses, D-avitaminosis. Contrary to the previously widespread opinion about the poverty of ordinary foodstuffs in vitamin D, research has shown that egg yolks and very many green parts of plants possess antirachitic properties. It can be achieved that milk and the fat of our animals will possess such properties (it is necessary to make rational use of antirachitic feedstuffs in animal husbandry). Attention must be paid to the fact that an excess of carbohydrates in diets contributes to their rachitogenicity. It should be remembered that liquid fats (cottonseed, sunflower, linseed, etc. oils) are devoid of vitamin D. The use of 'cod liver oil' in the prevention and treatment of rickets requires much more attention to this preparation than has been the case up to the present time. Vitamin E - see Vitamins. It is found in seeds and green leaves, in the yolk, in cottonseed oil; it can accumulate in the tissues of the animal organism (in muscles, in adipose tissue, less in the liver); there is little of it in milk, which, however, exclusively depends on the lactating animal. It should be noted that in oils - sesame, linseed, sunflower, mustard, and almond - there is no vitamin E. In view of the wide distribution of this vitamin in nature, it is easy to ensure human food rations. Judging by experiments with experimental animals, the human need for vitamin E is probably very insignificant, and therefore one can hardly fear the appearance of E-avitaminosis in humans. However, similarly to other vitamins, vitamin E probably exerts some influence on the general state of the organism, and it is very possible that with lower levels of it in food over a long time, some form of hypovitaminosis E may arise. However, to speak definitely about this at the present time is not yet possible. Physiological characteristics of foodstuffs and principles of compiling food rations. All our common foodstuffs can be divided into the following groups: 1) milk and dairy products, 2) eggs and various meats, 3) grain products, 4) vegetables and fruits (fruits, nuts), 5) fats and oils, 6) sugar and sugar products. 1. Milk and dairy products. Milk is characterized by the high physiological value of its proteins, easily assimilable at any age and capable of being completely used for anabolic purposes both in adult individuals and in growing ones. When added to bread and other grain products, milk increases their physiological value, introducing lysine and tryptophan into the diet, which grains (mainly cereals) are poor in. Along with this, milk is characterized by its rich calcium content. In phosphorus content, milk yields to many products, approaching white (polished) rice and dried prunes, and is very poor in iron: The total ash content in milk is also small (about 0.7%). One glass of milk (250 g = 160 calories) contains approximately: Table 13. Name of constituent parts Quantity % of daily requirement Ca.......\ i Fe........ Vitamin A . . . Vitamin B . . . 300 mg 230 » 0.6 » 30-35 g 550 units 82 » (?) about 50 » 20 » 4 * With a ration of 3,000 calories. Comparison of the mineral composition of cow's milk with that of other mammals gives table114, from which it is seen that women's milk is extremely poor in all metals and metalloids, which should be taken into account in the practice of feeding a child (the total ash content of women's milk is only 0.2%). Table 11. Types of milk I Ca I Mg I ' I K NaI P Cl I Fe Cow's milk whole .... Goat's milk . . . Mare's milk Sheep's milk Women's milk (in mg per 100 g product) 51 93 79 1103 10 ! 51 30 '123 10 | 15 106 1 14 29 71 35 0.24 The vitamin content in milk is subject to large fluctuations and entirely depends on the nature of the food of the lactating organism. By rational feeding of dairy cattle, the vitamin content in milk can be significantly increased. Unfortunately, commercial milk has for most of the year relatively few vitamins, and vitamin B is sometimes entirely absent in it. In one glass of milk, according to Sherman, there are 550 units of vitamin A, which may correspond in activity to 25 g of raw carrot, 10 g of spinach, about half an egg (30 g), 90 g of raw tomato, 200 g of beef suet, 10-30 g of butter, 1000 g of apples. Obviously, in terms of this vitamin content, milk occupies an average position. 1 glass of milk contains 80 units of vitamin B, which is equivalent to 45 g of yolk or 120 g of spinach. As an antiscorbutic product, milk mostly has weak activity, but also fluctuating within wide limits from 11 to 55 units per 1 liter. To increase the antirachitic properties of milk, various methods have been tried - the product itself was illuminated with a quartz lamp, the lactating animal (cow) was illuminated with it in order to cause an excess of vitamin D in its body, passing into the milk. At present, great importance is attached to attempts to supplement the diet of cows with some food product enriched in vitamin D by preliminary ultraviolet irradiation (for example, irradiated yeast). Which method will give the greatest economic and physiological effect will show the near future. With regard to the vitamins of group B, milk has rather low activity, approaching that of weak vitamin carriers. The significance of milk as a vitamin carrier of this kind, however, increases in comparison with other products close to it in activity, such as cabbage, carrots, apples, green beans, meat, lettuce, and potato, since it is impossible to eat as much of these products as one can drink milk in a day. American hygienists, noting the very high calcium content in milk, the good assimilability of all its organic substances, and the possibility of consumption in large quantities even by small children, consider this product an essential element of any table. Taking into account the relatively low content of mineral elements and vitamins, they recommend (as a slogan) the consumption of at least 'one pint of milk' (0.568 l) by adults and 1 quart (2 pints) by children. Cheeses, depending on the variety, have very different protein compositions - from 40% to 15%, fats (in inverse relation to proteins) - from 2% to 35%, and caloric content - from 180 to 420 calories (numbers are rounded). Due to their small water content (40-50%), cheeses are concentrated sources of protein, resp. fat, while retaining all the high biological properties of milk proteins. The mineral composition of cheeses probably varies with the variety, however, how great these changes are is difficult to say due to lack of specific data. In Sherman's lists, many varieties of cheese are given, differing in their content of organic substances, while the mineral composition is indicated for cheese without variety designation: Ca-931 mg, Mg-37 mg, K-89 mg, Na-606 mg, P-683 mg, Cl-880 mg, S-263 mg, Fe-1.3 mg per 100 g product. Except for K, all these elements increase their concentration compared to milk. There is no vitamin C in cheeses at all, vitamins B are either absent or very little, vitamin A - depending on the variety, on the fat content, as well as on the richness of this vitamin in the original product. In the literature, cheeses are described with strong, medium, and weak activity relative to vitamin A. 2. Eggs and various meat products. Eggs and meat, from the point of view of their significance in nutrition, are considered as carriers of proteins of high physiological value, and the ability of these proteins to support animal growth is beyond doubt.
In terms of protein content, eggs are somewhat below average meat, somewhat higher in fat, while the caloric value of these products and their total ash content are approximately the same. Compared to milk, both of these products are richer in protein and agar, but milk contains the specific carbohydrate lactose, which is not found anywhere else. In terms of calcium content, eggs are half as rich as milk, but twice as rich in phosphates. Egg yolk is a rich source of vitamins A, B, and D. Egg white contains a lot of vitamin B2 (the anti-pellagra factor) and no B1 (the anti-neuritic vitamin). As for other parts of the animal organism, besides meat itself, used in nutrition, such as: liver, kidneys, heart, brain - their composition in terms of main food substances differs little from meat, only their ash content (except for heart) is more than 1%, and the caloric value, as in meat, depends on their fat content. All these organs are characterized by a large amount of nucleoproteins (corresponding to the richness of nuclear substance in them), sterols and phosphatides, but they are poorer in the extractive substances found in muscle tissue. The biological significance of the proteins of these organs is very great. They are also rich in vitamins A, B, and even C (liver is considered as a depot of this vitamin). Meat, on its part, is characterized by abundance of K, P, and S. The last two elements make meat especially valuable from the point of view of mineral nutrition; in this respect, only legume seeds can compete with it. In terms of P and Ca, meat resembles cereals, while its Fe content is the same as in eggs. The chemical composition of egg yolk is extremely unique: it contains more Ca than in milk and a lot of P (the richest food source in terms of this element!), only dry legumes approach it somewhat. Egg yolk also contains a lot of Fe, so two yolks can cover the entire daily requirement of an adult for this element. Chem. composition of meat-see Meat. A feature of meat is the presence in it of a number of extractive substances (nitrogenous) that pass into the broth when meat is boiled and contain up to 15% of the total nitrogen (non-protein nitrogen); their composition includes: creatine, creatinine, nucleic bodies, sarcosine, etc., which increase the secretion of gastric juice and have a stimulating effect on the nervous system, hence the strengthening value of meat broths (strong broths). Like cereals, meat is poor in vitamins A and D (muscles themselves), in terms of vitamin B content it approaches milk and is significantly inferior to cereals (whole). There is no vitamin D in meat. Egg yolk is a rich source of vitamins A, B, and D, and according to American data (M. Rose), one yolk daily can fully protect children during the winter months from rickets. Egg white contains a lot of vitamin B2 (the anti-pellagra factor) and no B1 (the anti-neuritic vitamin). 3. Cereal products-chem. composition and caloric value-see Flour, Groats. The protein of these products is not complete in its main mass, as it has low digestibility, especially in legumes, and most importantly, does not contain a full set of amino acids, therefore the protein of these products, even when given in large quantities, cannot maintain the growth and development of organs to the same extent as animal proteins; the addition of the latter to cereal products even in small amounts makes the food completely complete in terms of its protein part. Hence follows the most important rule of nutrition - the mandatory consumption of mixed flour-milk or flour-meat (egg) food. In terms of fat content, cereal products are poor, somewhat resembling in this respect (in their natural state) whole milk (corn and oats) or semi-skimmed (rye, wheat). These products are very rich in carbohydrates. In terms of mineral composition, cereal products show great differences among themselves, and a general characteristic for them can be considered, firstly, that all of them have a small amount of Ca (from 45 to 50 mg% in whole wheat and in wheat bread from whole flour and up to 14 mg% in wheat), which places cereals on the same level with the vast majority of fresh food products, including meat, and contrasts them with cow's milk (120 mg% Ca), some legumes (peas, lentils, beans - 84-160 mg%), egg yolk (137 mg%), nuts (287 mg%), and cauliflower (123 mg% Ca); secondly, that in most cereals (also in contrast to milk, yolk, and cauliflower) Mg is either the same as Ca or more; in some Mg significantly predominates over Ca (e.g. in wheat more than 10 times!); thirdly, the sulfur content fluctuates within relatively narrow limits - 100-200 mg% (except for rice - 41 mg%). In terms of Fe content, wheat stands out sharply among cereals (5 mg% whole grain, whole flour with germ removed - 2.5 mg%, and oats - 3.8 mg%). Legumes (dry) are even richer in iron - 5.7-8.6 mg%. When compared with meat (with 20% protein content in it), it is seen that some cereals approach it in iron content (e.g. corn, oats, whole wheat flour), while others (most) are much lower; conversely, legumes are significantly richer in iron than meat, as well as in sulfur; it should be noted that the digestibility of ash elements in general is lower than that of organic substances and is approximately the same for products of both animal and vegetable origin. In terms of vitamins, cereal products, even natural ones, are very poor in vitamin A; if it is present, it is only in the germ part, together with vitamin B. On the contrary, products of the B group of vitamins are very rich in these products. Vitamin C is absent in dry grains, but appears in significant amounts during germination. According to data from the Sverdlovsk Institute of Nutrition (Gryaznov), 150 g of germinated legumes (peas, beans) is more than sufficient for the treatment of scurvy. There is also little or no vitamin D in seeds. 4. Vegetables, fruits, and nuts. Vegetables (chem. composition, digestibility and caloric value)-see Vegetables. Vegetables can be considered valuable carriers of mineral elements in food. The content of these elements in vegetables, however, is also not the same; in most, the fluctuations are the same as in cereals; they stand out in Ca content cauliflower with 123 mg% (like milk!), dandelion (leaves) with 106 mg% and spinach with 67 mg%. In terms of K content, most resemble cereals (dry) - 100-300 mg%, and just as in cereals rye and whole wheat contain more than 450 mg% K, so here this level is reached by potato and dandelion, and spinach reaches 774 mg% (approaches legumes). In terms of P and S, vegetables are extremely poor (below milk). In terms of Fe content, here the differences are very large; thus, spinach has as much Fe as in oats (3.6 mg%), dandelion can be compared with whole wheat flour (2.5 mg%). The others, although they do not reach such concentrations of Fe, still give numbers often found in cereals (1.3-0.6 mg%); however, tomato and cucumber are very poor in Fe (0.4-0.2), like milk. It is difficult to give a general characterization of the vitamin content in vegetables. From the data given earlier, it is seen that in terms of vitamin C, cabbage, potato, tomatoes, spinach, and radish have high activity, while in relation to vitamin A among vegetables there are representatives of outstanding activity, for example carrot and spinach. Vitamins of group B are represented here in medium concentration, there seem to be the most of them in spinach, others in terms of these factors can be compared with milk or meat. Fruits have enormous physiological significance. Besides the fact that they contain a certain amount of sugar (9-18%) (other organic substances in small amounts), they should be considered as taste substances of high value, allowing to improve to a very significant degree the organoleptic properties of the menu. In addition, fruits, like vegetables, contain fiber (mostly 1-5%, although some, like cherries, 0.3%), very delicate, having a corresponding effect on peristalsis, but not causing sharp irritations of the intestine. There are few mineral elements in these products, however, it should be noted that Fe in them is more than in milk (mostly 0.3-0.6 mg%, and in currants - 0.8 mg%, in blueberries - 0.9 mg%). In terms of K content, they resemble white bread, egg, buckwheat groats, etc. Vitamins are distributed in these products very unevenly. Some of them, such as oranges, lemons (some), cloudberry, black currant, have very strong anti-scorbutic activity; in orange, apple, plum, grape, pear, etc. the content of vitamin B corresponds to milk. In terms of vitamin A, fruits have weak activity. Nuts are consumed in small quantities, mostly as a delicacy (at least with us) and cannot be classified as common food products.
However, it should be noted that in protein content some of them approach meat (21%), in fat content! they can compete with fatty cheeses (50-70%), they have 3-4% fiber, quite a lot of ash - about 2-4%, and in calcium content they surpass milk, in phosphorus they approach legumes (350-465 mg%), they are very rich in sulfur (160-200 mg%) like eggs; they have about 4 mg% of iron (similar to oats and spinach). The vitamin B content in nuts is average, vitamins A and C content is weak. 5. Fats and oils. Sources of fat in human food, besides fatty varieties of meat (for example, fatty mutton contains up to 30% fat, pork - 35%) and fish (for example, eel - 28%), are butter and ghee, beef, pork, mutton and other types of lard, vegetable oils (sunflower, hemp, flax, cotton, mustard, etc.). A specially 'medical' fat is so-called 'fish oil' (fat of cod and other fish, more recently also of marine mammals). Digestion of fats eaten in customary quantities proceeds equally well regardless of the origin of the fat. Carriers of lipovitamins are practically only fats: butter (A, some B) and fish oil (A and D). Margarine contains no vitamins or only traces of them. -6; Sugar and products from it. The sugar used by us as food is a carbohydrate, a disaccharide, obtained from sugar beets. When refined (raffinade), it contains only a very small amount of water, thus being almost a 100% carbohydrate. Other types of sugars (maltose, malt sugar) are found in so-called malt extract, lactose is consumed by humans with milk. A number of hexoses (monosaccharides) - glucose, fructose, etc. - are part of the carbohydrates of sweet fruits and honey. On the significance of sugar, see above (carbohydrates). Any well-composed diet (adequate diet, in the terminology of American authors) should have not less than 1.5-1.8 g of protein per day per 1 kg of body weight with moderate work, with a further increase to 2 and even 2.5 g with heavy and very heavy work (in the energy sense). 3/4 of these proteins should be of animal origin. The total caloric value of such a diet should correspond to the given profession. The amount of fat 50-150 g and more depending on the severity of work. In addition, the diet should have all vitamins in the largest possible quantity (in the form of natural vitamin carriers) and also contain a sufficient amount of fiber to stimulate intestinal movements; mineral elements should be represented in food in a complete set; however, since the human need is determined - and that only provisionally - only with respect to Ca, P and Fe, these elements must be in the diet in established amounts; moreover, attention should now be paid to the amounts of other elements, especially S, not allowing their long-term depletion in food. When compiling food diets, one of the greatest difficulties is the question of the ratio of foodstuffs to each other. Table 15. Grain products........... 40-20% Milk................ 18-16% Vegetables and fruits........ 12-20% Fat products (butter, lard, etc.) . . ........... 12-18% Sugar and sweets .....v.....
8-16% Taking into account the just formulated principles, American authors consider the distribution (in percentages of the total caloric diet) of foodstuffs in food with moderate work (about 3,000 cal.) to be suitable. German hygienists (Koenig) give 'norms' under different working conditions, given in Table 16 (p. 90). B. Lavrov. III. The significance of dietary regimens in pathology. The profound effect of dietary regimens on metabolic processes in tissues is responsible for the variety of pathological conditions that are to some extent associated with improper nutrition. In a number of diseases, an irrationally constructed dietary regimen, along with other factors (working and living conditions, constitutional peculiarities), can influence the manifestation of disease symptoms and the course of the disease. Numerous clinical observations, including the most recent ones, undoubtedly testify to the influence of the nature of N. on the course of the tuberculous process. Landouzy and M. Labbe showed that among the tuberculous patients they examined, the overwhelming majority of patients ate incorrectly in terms of quantity or qualitative composition of food. Research by Ratbery has established that excessive intake of nitrogenous substances in tuberculosis patients worsens the course of the process, prevents weight gain, etc. Numerous studies have established the influence on the manifestation and course of the tuberculous process of deficiency of various vitamins, iron salts, calcium, various amino acids ensuring the plastic processes of the body. Finally, recently a number of authors associate the spring exacerbations of the process in tuberculosis patients with vitamin deficiency.
"Modern research also indicates that a number of pathological changes in the cardiovascular system are associated with the nature of the dietary regimen. Thus, Romberg showed that a decrease in the functional capacity of the heart can be the result of protein starvation in cardiac patients. Anichkov found in animals with excessive nutrition with fats or substances containing cholesterol, changes in the intima of blood vessels, similar to changes observed in humans with arteriosclerosis. Phenomena of pronounced arteriosclerosis on the basis of one-sided nutrition were observed in animals by Ignatovsky and Stukhey. Strasser discovered the influence of the nature of nutrition on the viscosity of blood. Feeding experimental animals with food rich in cholesterol (egg yolks, etc.) has as its consequence an increase in blood pressure (Fahr, Westphal and others). Skulsky and Haensslen showed that as a result of one-sided, improper nutrition (overloading with proteins), sharp pathological changes occur in the capillaries (phenomena of stasis, incorrect shape of capillaries, etc.). In numerous works by a number of authors, thickening, necroses, and degenerative changes in the intima of blood vessels were obtained in experiments on rabbits with excessive nutrition with proteins. Improper nutrition undoubtedly sharply worsens the course of various ailments of the cardiovascular system. And in the field of pathology of the endocrine system, there are indisputable proofs of pathological changes caused by the effect on the endocrine glands of improper nutrition (Biedl, Zondek and Düring) (see also Obesity). Proof of the influence of improper nutrition on the function of the endocrine glands are diseases of the thyroid gland on the basis of insufficient water content in food. In particular, this is shown in relation to the function of the sex glands (amenorrhea, sexual weakness). As for the field of skin diseases, here too there is evidence of a number of pathological changes in the skin associated with improper nutrition. Modern research of the Urbach school, indicating that a number of chronic skin diseases arise on the basis of improper nutrition, are very characteristic proof of the profound effect of improper nutrition on the body. Klauder and Brown found decreased excitability of the skin with inadequate nutrition. Schiff and Kramar observed a sharp decrease in skin turgor with excessive intake of proteins and insufficient introduction of fluids. The intensity of the Pirquet reaction, as Fornet was able to show, depends to a large extent on the state of the acid-base balance of the skin. The result of insufficient, one-sided nutrition can be the development of acne cachecticorum, dystrophy of the nails (Urbach), hair loss, the appearance of alopecia. Predominantly carbohydrate nutrition in children can lead to the development of furunculosis and hydremic forms of skin lesions (Urbach), excessive intake of NaCl to increased skin sensitivity, hair loss, increased secretion of the sebaceous glands and the appearance of weeping eczema (Schultz). According to the data of Kuipers, a lack of vitamin A in the diet can lead to the development of seborrheic ecema in children, and Sharpies points to easy infection of the skin with a lack of vitamin B in the diet. Observations conducted in the Therapeutic Nutrition Clinic testify to a significant effect in a number of chronic skin diseases with appropriate therapeutic nutrition. The clinic is well aware of the facts of the influence of a monotonous and vitamin-poor diet on the manifestation and course of various skin diseases (e.g., dryness of the skin, furunculosis, erythema, etc.)." According to research by a number of authors, improper nutrition (excess of animal proteins, extractive substances, lack of vitamins and a number of mineral salts) can be the cause of a number of pathological phenomena from the side of the autonomic nervous system. According to research conducted in the Therapeutic Nutrition Clinic, excessive carbohydrate load, especially with simultaneous insufficient introduction of vitamins into the diet, is a factor that worsens the course of various arthritis (rheumatic, infectious, tuberculous, deforming arthritis, etc.) in a significant percentage of cases, and at the same time a factor that in a number of cases, along with other factors (cooling, functional load on the joints), causes a recurrence of the disease. Along with these data concerning the role of improper nutrition as one of the factors that, along with others, can undoubtedly influence the manifestation of the pathological state of the body and the entire course of the disease, there are pathological states of the body in the development of which improper nutrition is the direct cause of the disease. This should include first of all a number of diseases of infancy and childhood (dystrophies with artificial feeding in infants, various dyspepsias in children on the basis of one-sided and excessive nutrition, Barlow's disease, anemias, insufficient growth, etc.). The absence or deficiency in the diet of various vitamins leads to a number of characteristic disorders (see Avitaminoses). Along with avitaminoses, easily reproducible in experiments on animals, the states of hidden avitaminosis or so-called pre-avitaminotic states undoubtedly have enormous importance for the clinic. Phenomena of general weakness, anemia, so often observed in convalescents, can be the result of qualitatively inadequate nutrition in the sense of a lack in the food of one or another vitamin. From this point of view, patients who for one reason or another are for a long time on dietary regimens with a low vitamin content require special attention from the physician. The deficiency of vitamins in the diet in a number of strict, special dietary regimens can lead to weakening of the body, a sharp decrease in appetite and hinder the restoration of the proper function of individual organs [persistent diarrhea in politicians, long on a vitamin-poor strict diet, persistent constipation and joint pain (Noorden)]. Pre-avitaminotic states can for a long time express themselves only in a number of symptoms from the general state of the body (general weakness, lethargy, reluctance to work, decreased performance, loss of appetite, disturbance of intestinal function, etc.). Pathological states of the body can also be caused by excessive intake of certain vitamins with food (calcification of the vessel wall, lesions of the heart and kidneys in children with excessive administration of vitamin D preparations, described by a number of authors). These data confirm the correctness of the position that both insufficient and excessive nutrition can lead to a pathological state of the body. The result of improper nutrition, both in the sense of one-sided insufficient supply of nutrient material to the body and in the sense of its excessive introduction, is a number of profound disturbances in metabolism and the functions of various organs (disturbance of metabolism during starvation and qualitatively inadequate nutrition, changes in metabolism and function of internal organs with excessive nutrition, negative influence of excessive nutrition on the course of gout, diabetes, joint diseases, in obesity, on diseases of the digestive tract, etc.) Of great theoretical interest and enormous practical importance for the clinician are those pathological changes in the body that are observed with qualitatively inadequate nutrition and can occur with prolonged administration for therapeutic purposes of individually qualitatively inadequate dietary regimens (regimens of incomplete starvation). This should include the development of general weakness, decreased performance (especially in children and adolescents) with insufficient intake of biologically valuable proteins with food (due to lack of necessary amino acids for plastic processes), phenomena of acidosis, general weakness with insufficient intake of carbohydrates, a number of painful disorders associated with insufficient intake of fats, various mineral salts, etc. Improper nutrition finally plays a significant role in the development of a number of diseases of the digestive tract; this should include the role that nutrition plays in the development of gastritis, colitis, some liver diseases, alimentary constipations caused by insufficient introduction into the gastrointestinal tract of corresponding food substances that are physiological stimulators of intestinal peristalsis (vegetable fiber, sugar substances, mineral salts, dishes containing organic acids, a lot of fat, NaCl, etc.). Improper nutrition can hinder the achievement of sufficient effectiveness from a number of therapeutic measures. According to research conducted in the Therapeutic Nutrition Clinic, the unsuccessful in some cases use of digitalis becomes effective with simultaneous use of therapeutic nutrition, the effect of mountain sun in tuberculous arthritis increases under the conditions of simultaneous action of an appropriate diet."
Research by a number of authors (Romberg and others) also indicates the possibility of a significant reduction in the therapeutic effect from various cardiac agents (e.g., digitalis) with simultaneous irrational (in terms of the load on the cardiovascular system) nutrition of the patient. The same influence on therapeutic measures can be exerted by an inappropriate nutritional regimen. Studies conducted in Zheleznovodsk (work of Pevzner, Chechulin, and Levin) indicate a sharp distortion of the secretory effect as a result of irrational distribution of meal times when drinking mineral waters. The same mineral source, as parallel studies on humans and Pavlov's dogs show, causes completely different dynamics of gastric secretion depending on the nature of the nutritional regimen. Here arises the major problem of interaction between the influence on the patient's organism of the nature of nutrition, on the one hand, and various therapeutic factors (climatic, balneological, medicinal, physiotherapeutic) - on the other.
G. Levin. IV. Nutrition of children. Physiology of child nutrition. The child's dietary regime must satisfy the following basic requirements: 1) caloric value sufficient not only to "cover daily g 'current' needs (associated with movement, work, etc.)', but also for the growth of the body; 2) sufficient content and proper ratio of proteins, fats, carbohydrates, and salts in food; 3) sufficient content of alkaline earth elements that neutralize acidic products formed in intermediate metabolism; 4) sufficient content of vitamins. Essentially, these are the requirements that a rational diet for an adult must also satisfy. However, to this day there are not yet sufficiently verified and substantiated data by means of which one could specify exactly what the content of individual food ingredients in a child's diet should be. On the contrary, given the current state of our knowledge, one must think that this is hardly possible. The same applies to the question of the total caloric value of food. It is necessary, however, to emphasize that at no age does qualitative or quantitative starvation cause such severe changes and disturbances in the body's functions as is observed in a child. Dystrophies, atrophies—all these conditions are observed mainly in early childhood, and it should be kept in mind that they can develop within a very short time. All this forces one to exercise extreme caution when compiling a child's dietary regimen, not to reduce the quantity of individual food ingredients, but on the contrary, to give them consciously in some excess, in order to ensure the best growth and development of the child's body. The quantitative problem of nutrition. As is known, the energy consumed by the body is spent, on the one hand, on basic metabolism, and on the other, to cover expenditures associated with movement, work, etc. In addition, a certain amount of energy is spent in connection with the specific dynamic action of food and on losses with excreta. In a child, to all this are added the expenditures associated with the growth of the body. In an adult, basic metabolism is a fairly constant value and amounts to approximately 22-24 calories per 1 kg of weight per day. In a child, basic metabolism is accompanied by the consumption of a significantly larger amount of energy and reaches 50-60 calories per 1 kg per day. With age, the energy consumption associated with basic metabolism gradually decreases (see Metabolism, metabolism in children). Basic metabolism accounts for approximately 60% of total energy consumption. This means that if 1600-1700 calories are spent per day on an adult's basic metabolism, then the daily energy consumption should be about 2,700 calories. However, it is known that these data are only suitable for people engaged in very moderate work. At the same time, data from a number of physiologists show that with certain individual types of work, the amount of energy spent per day reaches 5-6 thousand, and sometimes even 8 thousand calories. This forces one to conclude that the amount of energy spent on basic metabolism by no means always constitutes 60% of the total need. In each individual case, one must take into account the work that the given organism performs. In relation to a child, this circumstance is often underestimated, yet the amount of energy that a child, often very active, sometimes spends can be extremely large. From everyday experience it is known that 12-13-year-old children who are intensively engaged in sports consume significantly larger amounts of food than their adult parents, who work moderately and lead mainly a sedentary lifestyle. In order to get a real idea of the amount of energy a child needs per day, one must add at least 100%, and sometimes even 120%, to the number of calories that are spent on basic metabolism (Table 1). Table 1. Energy consumption in a child (Erich Müller). Energy consumption per day Age Weight Surface Basic exchange per day and calories with an addition for work (in years) (in kg) per day (in m²) (in calories) 30% 65% 100% 0,551 508,6 661,2 839,2 1017,2 2 0,590 541,7 701,2 893,8 1 083,4 0,626 574,7 747,1 949,4 1 149,4 - 1 0,660 605,9 787,7 999,7 1 211,8 0,688 637,2 828,4 1051,4 1 274,4 * { 0,727 667,5 867,8 1 101,4 1 335,0 0,759 696,8 905,8 1 149,7 1 393,в 0,791 726,2 911,2 1 168,2 1 452,4 0,822 754,7 981,1 1215,3 1 509,4 6 { 0,853 783,1 1 018,0 1292,1 1 566,2 0,883 813,9 1 053,9 1337,7 1 621,4 0,913 818,2 1 089,7 1 383,0 1 676,4 0,942 870,9 1 132,2 1 440,6 1 746,8 0,971 891,5 1 158,9 1 470,9 1 783,0 0,999 917,2 1 192,1 1513,4 1831,4 1,027 942,9 1 225,8 1 555,8 1845,8 1,055 968,6 1259,2 1 598,2 1 937,2 0,994,3 1292,6 1 640,5 1888,0 » { 1,111 1 020,0 1 326,0 1683,0 2 040,0 1,137 1 043,9 1357,1 1 722,4 2 087,8 1,162 1 066,8 1 386,8 1 760,2 2 133,6 " { 1,188 1,090,7 1 417,9 1799,7 2 181,4 1,214 1 114,6 1 448,9 1839,1 2 229,2 1,240 1 138,4 1 479,9 1 878,2 2 276,8 1,266 1162,3 1 516,9 1917,8 2 321,6 1,292 1 186,2 1 512,1 1957,2 2 372,4 ' { 1,317 1,209,1 1 571,8 1995,0 2 418,2 1,344 1233,9 1 601,1 2 035,9 2 467,8 1,367 1255,0 1 631,5 2 070,8 2 510,0 1,393 1 278,9 1662,6 2 110,2 2 557,8 14 1,416 1300,1 1 690,1 2 145,2 2 600,2 1,139 1321,1 1717,4 2 179,8 2 600,2 This is evidenced by Müller's data. Siebert's observations, who claimed that one could limit the addition to only 40-60%, were conducted on recovering children in a hospital, and it is therefore quite natural that the amount of energy consumed by these children was significantly lower. If one is to use the data of E. and F. Müllers, one should always remember that these data refer to a healthy, normal child. For a child lagging in development, these data should be correspondingly increased. In short, when calculating the number of calories needed for a child of a certain weight, in each individual case one must consider not his actual weight, but the weight that the child should have had with normal development. In addition, it is also indisputable that the amount of energy consumed by a child depends on a number of other factors, in particular on the conditions of the external environment and the constitutional peculiarities of the child. How different the caloric value established by various authors for different age groups is best shown in Table 2. While the Institute of Nutrition considers it possible to give a 13-year-old child 2,160 calories, Ignatov advises giving 2,055, resp. 2,417 calories, and E. Müller-3,093 calories. In the standards of the Institute of Nutrition, attention is also drawn to the circumstance that, while the daily diet of children aged 8 to 13 years contains 2,160 calories, Oktyabryata (7-10 years old) receive 2,566 calories. If one compares the ration of children aged 8 jto 13 years with the ration of Pioneers (children are accepted into the Pioneer organization from the age of 10), an even greater discrepancy is obtained. Table 2. E. Muller Ignatov Institute of Nutrition Age Calories Age Calories Age Calories 11/2 years 2 years 3-4 years 5-6 years 7-12 years 13-16 years 1215 1 375 1576 1 780 2 176 3 093 1-2 years 2-4 years 5-7 years 8-10 years 11-13 years 13-16 years 1132 1254 1518 1781 2 056 2 417 1-3 years 4-7 years 8-13 years 14-17 years Oktyabryata Pioneers 1 1 1 1 From all that has been said, a very important practical conclusion must be drawn: the caloric value indicated for a particular age group has relative value. In each individual case, it is necessary to monitor the condition and development of the child. If the child is not gaining weight or is not growing, then provided that the dietary regimen is composed satisfactorily in terms of biological value of proteins, one should increase its caloric value. The increase in the caloric value of the diet in various cases should be made at the expense of different food ingredients. Where one deals with a normal, well-developing, very active child, one should increase the amount of carbohydrates and fats, which are the main sources of fuel. In those cases where there is a growth retardation, one should think about increasing the amount of protein in the food.
The qualitative problem of nutrition (see also Metabolism, metabolism in children). Protein. The problem of protein, the question of the body's requirement (not consumption!) of protein, is still unresolved not only in relation to adults but also in relation to children. In physiology, there are extremely frequent works whose purpose was to determine that protein minimum at which the body maintains nitrogen balance (see Metabolism, nitrogen balance). In particular, in relation to the child, it is necessary to emphasize with all categoricity that nitrogen balance cannot be an indicator of sufficient protein content in food. On the contrary, in a child one should strive for a positive nitrogen balance. Another question is what this positive balance should be. In this connection, the question of the protein optimum arises. However, to resolve it is extremely difficult, since the biological value of proteins is very different. K. Thomas (Thomas) provides data on the biological value of proteins (see Metabolism, nitrogen balance). However, it must be said that these data of Thomas are disputed by many. One must be especially cautious when transferring these data to the growing organism. An illustration of what has just been said can be soy - the only apparently plant protein that is considered complete. If this is true for an adult, then in relation to a child this is definitely not the case, since the content of such growth-stimulating amino acids as cystine, tyrosine, lysine, tryptophan in soy is relatively small, and therefore soy cannot be considered a complete protein for the child's body. The difficulties arising when attempting to determine the protein optimum, the difficulties associated with the different biological value of proteins, are further complicated by the fact that the protein requirement of the child is not constant, but varies with age. The following table shows the protein consumption per 1 kg of weight (W. Sashenger). Girls Boys 2-4 5-7 8-10 11-14 15-18 5-6 1 7-10 11-11 15-16 17-18 12.7 16.6 22.3 31.9 41.0 18.0 24.0 34.0 52.8 59.4 86 1 3.6 3.0 2.7 2.1 1.5 3.5 2.8 2.5' 1.9 1.7 It is definitely not recommended to give more than 10-20% of the total calories in the form of protein, as this threatens some children with so-called 'protein nutritional disorder', and in the vast majority of them will cause an undesirable shift in metabolism in the direction of acidosis. Giving less than this amount is undesirable, as it can lead to a violation of the growth and development processes of the child's body. Finally, one more indication: when prescribing one or another protein diet, it is desirable to introduce not less than 50-60% in the form of biologically complete protein (milk and dairy products, eggs, beef, fish). Fat. If protein is basically a plastic material, serving for the construction of new and replacement of old, dying cells, then fats and carbohydrates are that component of food which covers the energy expenditure in the body associated with movement, games, work, etc.; this is the body's fuel. However, it would be incorrect to assume that the fats we consume in food have no other biologically important properties. The fats we consume consist not only of glycerin esters of fatty acids, they also contain 'impurities' in the form of sterols and lipoids, which are very valuable substances for the body. Lipoids are an important component of nervous tissue, they are found in all cell membranes, they have a close relationship to the state of immunity, and finally they are most closely related to mineral and water metabolism (see Lipoids). As for sterols, in recent years it has been possible to establish that they contain a number of vitamins, in particular the extremely important anti-xerophthalmic factor A (see Avitaminosis, D-avitaminosis) and anti-rachitic factor B for the child. Depending on whether the fat contains vitamins, biologically complete and incomplete fats are distinguished. Biologically complete fats include: butter, fish oil, egg yolk. Incomplete fats are margarine, beef tallow, a significant part of vegetable oils (see Fats). Camerer believes that children up to 13-14 years old should receive from 35 to 50 g of fat per day; in older age, it is advisable to increase this amount to 70-80 g per day. The amount of fat that a child should receive to prevent certain undesirable disorders (xerophthalmia, growth retardation, decreased immunity), which can be reduced to avitaminosis, has not yet been precisely determined. Observations conducted on this matter on children aged 1 to 3 years (the most vulnerable group) in the physiol. department of the Inst. for the protection of mother and infant of the People's Commissariat of Health, showed that when 40% of the total amount of fats is introduced in a biologically complete form, no disorders were observed. Carbohydrates. The increased glycolytic function of the cells of the growing organism, the unique course of cellular processes as a whole, and the greater mobility of the child sufficiently explain the high need of the child for carbohydrates. When an insufficient amount of carbohydrates is introduced in combination with an excess of protein, it is possible for sugars to be formed from amino acids, and perhaps even from fats. However, these sugars formed in the intermediate metabolism in the body itself turn out to be insufficient, and as a result, signs of carbohydrate starvation appear, which are especially sharply manifested in early childhood in the form of a stop or even a drop in the weight curve, the excretion of ketone bodies, etc. In older children, such phenomena are observed extremely rarely and have no practical significance. The fact is that with ordinary mixed food, the child receives a sufficient amount of carbohydrates, and therefore in practice one does not have to deal with the question of carbohydrate deficiency. Carbohydrates belong to those food ingredients that we do not strictly ration. The introduction of carbohydrates is especially advisable in the form of vegetables. The child thus receives along with carbohydrates a large amount of mineral compounds. Abundant feeding of the child with products containing a significant amount of carbohydrates in pure form (sugar, flour, etc.) can lead to undesirable phenomena in the form of puffiness. This is explained by the pronounced hydropic properties of carbohydrates. On the basis of experience, it can be said that per 1 kg of weight, a child under 10 years of age should receive from 10 to 12 and even up to 15 g of carbohydrates. In later age, 8-10 g is sufficient. It is quite natural that with increased muscular exertion (playing football, skiing, skating, etc.), the amount of carbohydrates, which mainly covers the energy expenditure, should be (at least for this period of increased work) correspondingly increased. The desirable total content of carbohydrates in the food ration is from 40% to 60% of the total amount of calories. Vitamins. Sufficient vitamin content in food has a doubly great importance for the normal development and growth of the child's body. Undoubtedly, along with sharply expressed clinical pictures - so-called avitaminoses - there are other disorders, very often not recognized as avitaminoses. One could speak of preavitaminotic conditions. These include growth retardation, decreased resistance to infections, tendency to hemorrhages, etc. Therefore, we currently provide the body with vitamins through substances containing them in significant amounts. Thus, vitamin C is contained in significant amounts in vegetables and fruits (fresh). If the diet is composed in such a way that the child receives about 500-600 g of vegetables and fruits per day, then one can be sure that no signs of disorders arising from a deficiency of factor C will appear. In doubtful cases, juices can be introduced. Mineral compounds. R. Berg (Berg) first pointed out that it is advisable to introduce such an amount of alkaline earths that could neutralize all the acidic products of intermediate metabolism. In short, Berg insists that the diet should contain some excess of alkaline earths. This point of view is now considered as if generally accepted. For its practical implementation, it is important to introduce carbohydrates in the form of vegetables containing significant amounts of salts, and on the other hand - not to overload the body with too large amounts of proteins and fats. The question of the body's need for individual mineral compounds has been insufficiently studied. Theoretically, one can assume an increased need of the body for calcium and phosphorus during periods of intensive growth. The consumption of the most important mineral components is indicated in table 4. Table 4. Consumption of various mineral substances per 1 kg of weight per day. (E. u. F. Muller). Age CaO P2O5 SO3 NaCl Boys Girls 0-1 year 0.031 0.028 0.024 0.023 0.011 0.013 0.115 0.103 0.095 0.040 0.034 0.031 0.098 0.090 0.083 0.024 0.020 0.020 0.311 0.331 0.293 0.021 0.048 0.027 Some data on the question of the use of individual food substances. Until recently, the question of which food substances can be given to a child and which cannot be given was still discussed in pediatric literature.
This was explained by the assumption that the child's organism does not possess a sufficient quantity of enzymes and juices necessary for the digestion and assimilation of various kinds of food. At the present time it is known that a child, even at birth, possesses a complex system of enzymes, sufficient for the breakdown, digestion and assimilation of any constituent parts of food. The matter comes down only to the fact that all these enzymes are present in insignificant quantities; the enzymes with which a child is born possess, so to speak, potential energy. When there is a demand for these enzymes, their 'potential energy' is transformed into kinetic energy. For example, Hamburg succeeded in feeding infants without a single drop of human or cow's milk. He covered the need for animal proteins by introducing various purees of parenchymatous organs (liver, spleen, kidneys, brain tissue). From this it can be concluded that with a properly composed food ration, a child can theoretically receive everything that an adult receives. If such a ration is difficult to compose in the first year of life, these difficulties are already significantly less in the second year. At this age, i.e., starting from the second year of life, these difficulties depend less on the functional ability of the digestive tract than on the absence of a sufficient masticatory apparatus. This forces one to give the child in the second year of life and until the appearance of a sufficient number of teeth food in a well-chopped or pureed form, and the child's table and the adult's table can be fundamentally the same, provided only that the adult receives a rationally composed food ration. Milk. About 25 years ago, there was an extremely widespread tendency in everyday life to introduce significant quantities of milk to children with an already high protein content in food. As a result of this, disturbances were repeatedly noted, mentioned above as 'protein nutritional disturbances.' The reaction to this from pediatricians was a sharp restriction of the amount of milk in the child's ration. Müller gives the following norms: 2nd year of life - 400 g, 3-4 years - 350 g, 5-6 years - 300 g, over 6 years - 250 g. These norms of Müller are reprinted year after year without any changes in various guides and works devoted to questions of child nutrition. However, it should be borne in mind that they are undoubtedly correct for those cases when the child's table is mixed, varied and contains a sufficient amount of protein. In those cases where the child's table contains an insufficient amount of protein and in particular biologically complete protein, increasing these norms does not give any harmful consequences. Mac Collum describes one children's institution in which, receiving a meager ration, children gained weight poorly and showed a relatively high morbidity rate. The additional introduction of 750 g of milk gave excellent results in terms of growth and weight gain of these children. One should fear 'milk anemias' and other 'protein nutritional disturbances' only in cases when milk is introduced into the child's organism without any norms, as a 'drink.' However, it should be said that in recent years such disturbances are almost never observed. Meat. The question of the use of meat in recent time has been decided by the majority of authors in the sense that meat can be introduced to a child already at the end of the first year of life. At first it is advisable to introduce well-chopped parenchymatous organs (liver, spleen, etc.), containing besides a significant quantity of purines also other very valuable substances for the child. Norms (empirical) for meat and fish products for children of various age groups are given below, in tables and menu plans. Eggs. It is undoubted that some children (exudatives) tolerate eggs poorly, but it is also undoubted that children with a normal constitution and a normal digestive tract assimilate eggs already at a comparatively early age. Moro introduces egg yolk already from the 5th month of age and points out that it is well tolerated even by children suffering from exudative diathesis. In the physiological department of the Inst. for the Protection of Mother and Infant Health of the People's Commissariat of Health, children received egg yolk from the 7th month of age for special indications (delayed growth, rachitic changes, insufficient weight gain). The introduction of eggs containing biologically complete proteins, lipoids and vitamins should be considered possible thus already from a comparatively early age and undoubtedly indicated in certain disturbances. Norms are given below in menu plans and tables. Soy. In recent time, soy has aroused great interest, being considered the only protein of plant origin containing all amino acids and therefore being a biologically complete protein. However, there is no doubt that the insignificant content of cystine, lysine, tyrosine and tryptophan in it significantly diminishes its merit as a food means for children. Nichols and Daniels, conducting experiments on rats, established that 5% casein in the food of the experimental animals ensures their normal growth and development. To obtain the same effect when using soy protein, it is necessary to introduce it in the amount of 21%. However, these data do not give the right to consider that soy protein cannot be a constituent part of food for children's dishes. An observation conducted in the physiological department of the Institute for the Protection of Mother and Infant Health of the People's Commissariat of Health (Serebriisky and others) showed that soy protein can completely freely cover from 20% to 25% of the child's protein requirement. The methods of using soy are the most diverse. It can be used both in the form of soy milk and as a constituent part of various dishes (soups, puddings, cutlets, etc.). Broth. Among many physicians, even to this day, the idea of the high value of broth is extremely widespread. It should be said that the caloric value of lean broth is extremely low (about 40 cal. per 1 liter); as a nutrient means, broth therefore cannot be considered. As for the extractive substances, which are strong secretagogues, it should be borne in mind that various diseases of the stomach, proceeding with decreased secretion of gastric juice, are rarely observed in childhood. In the period of convalescence, such decreased acidity of gastric juice seems to occur more often; in these cases, the use of strong broth can be considered even indicated.
Serebriisky. Disturbances of Digestion and Nutrition in Early Childhood. In view of the fact that the processes occurring inside the gastrointestinal canal, digestion in the narrow sense of the word, are closely connected with nutritional disturbances, disturbances of digestion and nutrition always have to be considered together. But physicians came to this conclusion not so long ago. Previous authors considered diseases of the gastrointestinal canal as independent and even singled out diseases of the stomach, small and large intestines into separate units. In this anatomical classification (Billard, Wiederhofer, Baginski, 1880), diseases of digestion were divided into those associated with inflammatory changes of the mucous membrane (catarrhs) and those depending on functional disorders of the gastrointestinal canal (dyspepsia). These processes were divided into acute and chronic. Processes expressed in
NUTRITION
104. The changes occurring in the organism and taking place beyond the intestinal wall, of course, did not escape the attention of clinicians, but were considered only as accompanying phenomena and were not given sufficient consideration in this classification. However, despite the fact that the patho-anatomical changes underlying it did not always correspond to the severity of the disease and that many of these changes, as was definitely established, occur postmortem, this classification continued to exist until the beginning of the 20th century. During the period of the vigorous development of bacteriology, attempts were made at an etiological classification of digestive disorders based on the study of the flora of the gastro-intestinal tract, but these attempts did not yield practical results, as for most diseases of the gastro-intestinal tract it was not possible to establish specific microbes. In 1905, Czerny, and after him Finkelstein, put forward a new justification for the classification of these diseases. They based the division on the view that the processes observed in the gastro-intestinal tract are only part of the disease; along with them, intracellular digestion always occurs, with the formation in the cells of visceral organs and the entire organism of a number of toxic products, as a result of which there is a disturbance of N. of the entire organism, which acquires the main role in the entire picture of the disease. Czerny proposed to divide all forms of disorders of N. into 3 groups according to the etiological factor: disorder from food (ex alimentatione), from infection (ex infections), from constitution (ex constitutione). The harmful influence of the food itself may depend on the excess, resp. deficiency of the total quantity or of its individual components. In this case, certain clinical pictures are obtained with a corresponding symptom complex, allowing for differential diagnosis. The influence of bacteria may manifest itself either directly on the gastro-intestinal tract in the form of inflammation of its mucous membrane and then on the entire organism, or the bacteria act on the food, from which, as a result of its bacterial decomposition, a number of poisonous products are obtained, which in turn disturb the metabolism of the organism. Finally, the focus of infection may lie outside the intestinal tract (parenterally), and the toxins produced in this focus affect all cells of the organism, including the cells of the gastro-intestinal tract, causing disturbance of the function of the latter. The basis for the third group of diseases, ex constitutione, is the fact that the same food is tolerated differently by different children of the same age and living under the same conditions. The matter concerns children having different congenital properties of the organism (diatheses), by virtue of which the latter reacts differently to the same food or harmful factor. Finally, the fourth group, according to Czerny, consists of disorders of N., depending on organic defects of congenital origin: cleft palate, Hirschsprung's disease, stenosis of the pylorus, etc. Thus, Czerny's classification results in the following scheme: 1. Disorders of N. depending on food: a) milk disorder of N., b) flour disorder of N., c) Varlov's disease (infantile scurvy). 2. Acute disorders of N. depending on infection: a) enteral infections, b) acute disorders of N. in the narrow sense: dyspepsia (mild form), food intoxication (severe form). 3. Disorders of N. depending on constitution: a) exudative diathesis, b) rachitic diathesis, c) anemic diathesis, d) neuropathic diathesis. 4. Disorders of N. due to congenital defects in the structure of the body.' The classification proposed by Finkelstein was based at first, besides the principle mentioned above, also on functional diagnosis, on the degree of endurance of the organism to food. A normal child has a relatively wide amplitude of tolerance, i.e., he tolerates without disturbance of N. quantities of food significantly exceeding the average amount. On the other hand, with a significant reduction in the quantities of all food or of its individual components, the normal child gradually loses weight. In disorders of N., especially far advanced, a so-called paradoxical reaction of the organism is obtained, i.e., to an increase in food, sometimes not even bringing its quantity to the average norm, the child reacts with an intensification of local (diarrhea) and general phenomena (increase in t°, loss of weight, etc.). In the hunger test, a rapid, strong loss of weight reaching several hundred grams and subnormal t° is obtained. Finally, as a third basis for distinguishing various forms of nutritional disorders, Finkelstein considers the presence of so-called paratrophy, i.e., the state of a child representing as it were incomplete health, a transition to disease. Such a state may, for example, express itself in a relatively large deposition of fat, and with such apparent nutrition the child is flabby, pastose (paratrophia adiposa); there may also be paratrophia hydrolabilis, when the cells of the child's body easily retain water but also easily lose it, not binding it firmly to the cell, as a result of which there are sharp fluctuations in weight, characteristic of such a child. These states are also accompanied by a decrease in immunity, frequent infectious diseases of the child, from which disorders of N. with the character of so-called dystrophy easily develop. Finally, in his latest classification scheme, Finkelstein also introduces the etiological factor to distinguish one form from another. Therefore, the scheme took on rather a complex appearance in his case and consists of the following groups of diseases: A. Dystrophy. I. Dystrophies without specific changes in organs. 1) Dystrophies in hydrostable individuals (arrest in tissue building, arrest in increase of weight - d. simplex): a) without diarrhea, b) with diarrhea, mild 2) Dystrophy in hydrolabile individuals (steep loss of weight, progressive exhaustion - d. hydrolabilis): a) mild, b) severe severe-----:------------>-decomposition Dystrophies accompanied by specific changes in organs (scurvy, keratomalacia). B. Acute nutritional disorders with diarrhea. / more mild- more severe- dys- enteral 2) Secondary pepsia catarrhal (after Primary 1 i infec food t tions and over- intoxication dyspeptic heating coma 1 All these states are not separate nosological units, but represent various phases, which may, although rarely, occur in a pure form, but more often 10S toe present a mixed picture or may pass one into another under the influence of external and internal factors, including therapeutic measures. To these groups are added: C. Group of constitutional diseases (hypoplasia, gigantism, arachnodactyly, chondrodystrophy, diatheses). D. Disorders of N. on breast feeding. E. Local diseases of the digestive organs (stomach, intestines, peritoneum, liver, etc.).- The works of Czerny and Finkelstein and their collaborators were undoubtedly a turning point in the study of disorders of N. and digestion, they have given and continue to give very much for elucidating the essence of these diseases. The classifications proposed by them, however, are poorly applied in practical work, since the etiological principle (Czerny) encounters the difficulty of establishing the basic cause of the disease in each particular case, not to mention that in life diseases are encountered mainly under the influence not of one, but of a combination of etiological factors. On the other hand, in Finkelstein's clinical classification, functional tests and determination of paratrophy present great difficulties and are rather accessible only to clinics, and not to practical institutions and consulting physicians. A symptomatic clinical classification of digestive and nutritional disorders is the scheme 'proposed by Marfan, head of French pediatrics. He divides all diseases of the gastro-intestinal tract into 4 groups with predominance of one or another symptom: vomiting, diarrhea, constipation and decline of N. In each group, diseases break down either according to the etiological sign or according to the degree of lesion. 1. Disorders with predominance of the symptom of vomiting', '2. Disorders with predominance of the symptom of diarrhea', '3. Disorders with predominance of the symptom of constipation', '4. Disorders with predominance of the symptom of decline of N.'
v Severe hypotrophy (2nd degree) Atrophy (3rd degree) Marfan himself considers that his classification has two advantages: first, it facilitates the diagnosis of disorders of N. and digestion, because, as he says, starting from the symptom, it makes it possible to rise to the syndrome and then to reach an understanding of the pathological condition and finally to the nosological species. Simple diarrhea Specific infectious diarrhea (very rare in infancy) Disorders with predominance of constipation Habitual constipation Intestinal obstruction Disorders with predominance of malnutrition and its causes. Second, it is sufficiently flexible to include all future achievements without changing its framework. The most significant drawback of this scheme by Marfan is that one symptom, even when predominant over others, does not always characterize only one specific disease, and clarification of the etiological factor, as already indicated, is often practically very difficult to achieve in each individual case. There are still several classifications that also poorly satisfy the theoretical and practical requirements for a systematization of diseases of N. and digestion. For example, Prof. Reier proposed a scheme where the basis for division is the deficiency of one or another vitamin in food. The one-sidedness and unsuitability for application to life of such a division is self-evident. However, the necessity of some classification for the uniform development of the colossal material accumulating in children's institutions is self-evident. Therefore, at the 2nd All-Union Congress of Pediatricians in 1923, a temporary working classification was developed; in which all diseases are divided into chronic disorders of nutrition and acute disorders of digestion and N., and it is desirable to add the etiological factor to the diagnosis (of course, where it can be definitely determined). American authors, and among German professors, Langstein, have finally come to the same scheme (in 1926). The experience of recent years has shown that it perhaps best satisfies the practical worker in the field of mother and child protection and makes it possible to process the material.* With some changes introduced by the 4th Congress, it has the following form: (Purely alimentary Alimentary-infectious Infectious Constitutional 1) Of alimentary origin 2) As a partial manifestation of infection 3) Of mixed origin (Bacteriologically established cases of dysentery belong to the group of epidemic infections.) This classification is currently used by all institutions for the protection of motherhood and infancy in the USSR. If one follows a series of children during their first year of life, one will hardly find a child who would remain free during this first year from any disorder of N. and digestion, even if he is breast-fed, let alone artificially fed. According to data from consultations in Moscow in 1929, disorders of N. and digestion in sick children who visited the consultation account on average for no less than 25% of all diseases; at the same time, mild cases that resolve spontaneously between visits to the consultation and do not appear in the reports of the latter are not taken into account. Also not taken into account are those cases of dyspepsia and colitis where the main disease is influenza and other infections (table 5), which are assigned to the appropriate rubric. * In the 9th German edition of the 'Textbook of Children's Diseases', edited by Prof. Feer, Finkelstein and Meyer give almost the same simplified classification scheme. Chronic disorders of N. Acute disorders of N. and digestion Hypotrophy Atrophy (1) Acute dyspepsia 2) Toxic dyspepsia 3) Acute colit Table 5. Morbidity of children under 1 year of age. Diseases 1920 1921 1923 1924 1925 1926 1927 Disorders of nutrition and digestion Influenza and diseases of the respiratory tract 39.3 29.7 36.6 33.3 34.3 32.3 34.7 32.7 30.6 32.3 26.3 32.7 23.0 36.8 28.5 33.3 The frequency of these diseases and their enormous significance for the child are also indicated by the mortality figures (tab. 6). Table 6. Mortality of children under 3 years of age (in % per 100 deaths)._________ Diseases under 1 yr. 1-2 yrs. 2-3 yrs. under 1 yr. 1-2 yrs. 2-3 yrs. Diseases of the digestive tract Influenza and diseases of the respiratory organs Congenital weakness and prematurity All others 25.0 23.4 28.6 23.0 24.29 25.4 0.16 51.15 12.14 18.71 0.15 69.0 25.0 21.37 28.61 25.02 16.66 28.52 0.24 54.58 6.23 21.26 0.11 72.4 From table 6 it is evident that the percentage of all children who died under one year of age is accounted for precisely by those who suffered from digestive disorders. And here one must also take into account the circumstance that the vast majority of children who died from other diseases simultaneously suffered from acute or chronic disorders of N., which may have already ended by the time the child developed the main disease that led to death, but the disease itself arose and was so severe precisely because the organism was weakened by the previous disorder of N.; without it, the child might have coped with the disease. Thus, the number of diseases involving digestive and nutritional disorders significantly exceeds these statistical data and is predominant in early childhood (up to 2 years). All these disorders, both chronic and acute, especially recurrent, markedly weaken the child's organism, create a favorable ground for other diseases, and as a final result become the cause of death or of retarded development and inferiority of the organism even in later periods. The struggle for the improvement of the health of the working people cannot be waged without taking into account and, as far as possible, eliminating this group of diseases in early childhood. Among the factors that significantly influence the frequency and severity of digestive and nutritional disorders, first of all attention must be paid to the influence of age. The younger the child, the relatively sooner he contracts these disorders. The same table 6 gives direct indications of this fact. This increased morbidity is generally conditioned by the still low stability of the child's organism, the lability of the functional capabilities of his organs, as well as by the high intensity of work of the digestive tract and the intensity of intermediate metabolism that occur in early childhood. Never at any other time except the intrauterine period does the organism have such intensive growth and does not give such large increments in weight as precisely in the first year. In close connection with age stands another main factor in disorders of N. and digestion - this is improperly conducted artificial feeding of the child, the more harmful and severely affecting his N. the earlier it began. The achievements attained in the field of dietetics for early childhood give the right at present to say that one can raise a child artificially, and he will not suffer from digestive and nutritional disorders and will give proper development in weight, growth, and functional capabilities. However, to achieve these results a great deal of experience and knowledge and a huge expenditure of energy are required to create appropriate conditions for the child, so that practically at present one still has to stand for the widest possible dissemination of breastfeeding or breastfeeding with supplementary feeding (mixed). -Furthermore, the environment in which the child lives and is raised, i.e., living conditions, climatic and local conditions, housing and its surroundings, the awareness level and sanitary knowledge of parents, on whom the care of the child depends, their economic position, the degree of involvement in the new way of life in general and in the area of child-rearing in particular (use of consultation, crèches, milk kitchens, etc.), have enormous significance for the frequency of diseases involving nutritional disorders. The reduction in child mortality in cities, which has reached approximately 40% in recent years, stands in indisputable dependence on this factor. The more parents are involved in the new way of life, the more children are covered by institutions for the protection of motherhood and infancy, the less their morbidity from digestive and nutritional disorders and other diseases. The next factor, which sharply affects the state of N. and proper development of the child, is infection -enteral and parenteral.- The changes that occur in the organism under the influence of poisoning by toxins arising in the infectious focus first affect the enzymatic function of cells and especially the glands of the digestive tract, the autonomic system, and intracellular metabolism, from which violations of the proper course of processes both of food processing and of deep processes of dissimilation and assimilation occur. The smaller the child, the more frequently and severely his digestive tract is affected when parenteral infection, local or general (influenza, otitis, skin abscesses, etc.), arises.
The second factor contributing to the development of parenteral digestive disorders is the fact that the intestine is an organ through which not only poisons present in the patient's blood, toxins (e.g., mercury), but even bacteria (typhoid, dysentery) are excreted, which serves as the cause of nutritional disorders. Finally, the constitutional factor, especially constitutional anomalies (diatheses), has a great influence on both the frequency of diseases of early childhood involving nutritional and digestive disorders, and on the severity and duration of these diseases. Children suffering from diatheses are most likely to become victims of these diseases. Thus, the incidence of nutritional and digestive disorders depends on a number of the mentioned factors (age, type of feeding, environment, infection, constitution), and almost always on their combination, and represents a complex phenomenon consisting of external and internal factors, with the predominance of one or the other of them. For a clear understanding of the disease, for the possibility of preventing a more severe course, and for the effectiveness of therapeutic measures, it is necessary in each case to determine the degree of influence of each of these factors. According to their course, nutritional disorders are easily divided into the two indicated groups: acute and chronic diseases, of course with the presence of a number of transitional forms. The relationship between them is expressed in the ease with which an acute disease passes into a chronic form in the form of hypotrophy, and then atrophy, which in turn are the most favorable soil for the development of acute dyspepsia or colitis. The factors predisposing to the appearance of acute nutritional disorders in these cases particularly easily exert their influence. Individual nutritional disorders—see Infantile Atrophy, Infantile Hypotrophy, Dyspepsia, Infantile Intoxication, Colitis.
V. Spersky. Public Child Nutrition. Individual child nutrition in the USSR in recent times is increasingly receding into the background. In those cases where the child is at home, he can essentially receive the common table on the condition that the food will be sufficiently finely ground.—In connection with the transfer of a significant part of industrial workers to public nutrition, public child nutrition acquires enormous importance. Table 7. Daily ration for children from 1 to 3 years inclusive. Quantity of digestible substances (in g) Quantity of cal. proteins fats carbohydrates Rye bread,.. . 2.9 0.13 18.18 87.9 Wheat bread 5.63 0.29 36.15 173.93 Cereals (buckwheat, rice, semolina). . 2.51 0.43 20.33 97.7 Macaroni .... 0.92 0.05 7.33 34.34 Potato flour 0.07 - 7.33 30.34 Honey..... 0.02 1.51 6.31 Coffee, tea . - Potato. 1.65 0.18 20.98 94.5 Other vegetables. . 1.0 0.2 6.45 34.7 Fresh fruits 0.27 -- 12.38 51.9 Dried fruits . . 0.30 - 8.98 38.1 37.6 154.2 Total of plant products 689 15.3 1.28 177.2 803.92 Milk (including sour cream and cottage cheese) 13.08 15.24 15.72 260.0 Butter 0.15 13.07 - 122.2 6.38 1.24 - 37.7 2.0 1.95 0.08 26.7 . Total of animal products 21.61 31.5 15.8 446.6 Total . . . 1 112 36.91 '32.78 1 250.52 A whole series of questions arises, both organizational and technical, and purely theoretical, which the Soviet Union has to solve for the first time. In this sense, we cannot borrow anything from the West, since there these questions have not yet been practically developed. If we speak of children of preschool age, then the already planned in the near future 100% coverage of these children with nurseries raises the question of the type of institution that should ensure children of nursery age with a daily food ration. Table 8. Daily ration per child for kindergartens and playgrounds. Quantity of digestible substances (in g) Quantity of cal. as, proteins fats carbohydrates Rye bread 6.59 0.64 47.5 227.75 Wheat bread 125 9.19 0.49 58.91 283.75 Wheat flour 10 0.68 0.14 5.59 27.05 Potato flour 0.04 - 4.39 18.2 Cereals and legumes 53 .5.61 - 1.22 33.21 Rice..... 1 . 6 0.32 0.05 4.47 20.08 Macaroni . . 0.56 0.03 4.4 20.6 Potato. . 2.2 0.3 28.0 126.0 Cabbage . . . 1.0 0.2 3.0 18.7 Carrot . . 0.28 0.07 2.86 13.6 Other vegetables 0.3 0.06 2.5 11.5 Dried fruits 0.16 - ; 4.49 19.04 Berries and fruits юо 0.3 - 12.4 51.9 Sugar and sweets 16 - 15.04 61.7 Vegetable oil - . 2.81 - 26.37 Total of plant products 8€0 27.26 6.04 226.79 1 097.01 Meat and meat products . 5.97 4.19 - 63.4 Herring . . . в 0.51 0.43 - 6.15 Fish . . 4.64 0.15 - 20.35 Milk. 7.48 8.57 8.83 146.55 Oil . 30 ч 0.09 8.17 - 76.38 Cottage cheese. 4.1 0.20 0.6 _ 21.3 Sour cream 0.72 2.68 - 27.89 Eggs. . . ' 16 1.9 1.81 0.08 2Б.16 Total of animal products 25.41 26.23 9.51 .387.18 Total . . , . 1 327 52.67 32.27 236.3 1484.19 The Central State Scientific Institute for the Protection of Mother and Infancy of the People's Commissariat of Health in Moscow has already begun construction of the first not only in the Union but in the world, so-called children's food station, which represents a combination of a milk kitchen with a supplementary food kitchen. It is planned that this first children's food station will provide daily provisions for up to 40 thousand children. All processes will be maximally mechanized. Ready-made food will be delivered by automobile1 to both nurseries and other places (home nurseries, yards), in which there is a significant concentration of nursery-age children. Children's canteens. School canteens'. It is completely natural that the maximum development of public nutrition requires the provision of public nutrition not only for nursery-age children but also for children of older age groups. In connection with this, special children's canteens will begin to function in the near future, the task of which is to provide for children aged 4 to 7 years (i.e., children in kindergartens and playgrounds). The principle of supply is probably the same as for nursery-age children. For school-age children, public child nutrition takes various organizational forms. On the one hand, by government decree at all Ill List of dishes for child nutrition with indication of the quantity of ingredients, quantity of digestible proteins, fats and carbohydrates, as well as caloric content (according to Pevzner and Ignatov). The daily menu is compiled from this list on the basis of the above tables of the daily needs of children of various age groups. (B.-proteins; Ж.-fats; У,-carbohydrates; K,-caloricity; quantity of products-in grams.) Soups (Salt is added to taste, water-200-400 g) 1. Borscht Meat..........
75 Fresh cabbage ....
50 Carrot ....'...
5 Wheat flour ....
5 Butter ....
5 Butter ....
5 Butter ....
20 Wheat flour ....
8 Butter ....
50 Wheat flour ....
80 Fresh cabbage ....
25 Butter ....
j.2 Wheat flour ...'
25- (B. 0.6; F. 0.3; C. 44.5; K. 187.7). 61^ Cream thick. Thick cream..... 60 Sugar ......... 15- Gelatin ....... > (B. 6.1; F. 10.8; C. 16.5; K. 193.1). 62. Apple jelly Apples..........100. Gelatin ....... 6. Sugar ......... 1» (B. 5.0; C. 25.3; K. 121.2). 63. Pudding with jam White bread...... 5. Milk.........100 Sugar ......... 10 Butter ......... 10. Jam......... 15- Eggs..........1 pc. (B. 12.2; F. 17.9; C. 48.8; K. 416.6). 64. Apple charlotte Fresh apples ..... 100 Stale wheat bread ......... 35 Butter .... 12; Milk......... 20 Sugar ......... 20 Eggs.......... 1 pc. (B. 5.2; F. 20.8; C. 61.0^ K. 464.9). 65. Baked apple Antonovka apples . . 150- Sugar.......... 10. (B. 0.4; C. 25.9: K. 107.8). In schools, hot breakfasts should be organized. A brief excerpt from the resolution of the Council of People's Commissars of the RSFSR, published in T aJJ l, 9. Daily ration for o k t y 5 r y T. Quantity of digestible nutrients (in g) Quantity of cal. of proteins fats carbohydrates Rye bread . . 10.54 1.02 76.0 364.4 Wheat bread 16.0 0.76 96.4 463.8 Wheat flour 1.51 0.15 11.25 53.7 Potato flour . . . 0.07 - 7.33 30.3 Cereals and legumes 5.03 0.87 32.19 160.7 Rice . . 4 . . . . ' 0.32 0.05 4.47 20.1 Macaroni .... 0.93, 0.05 7.33 34.3 Potato . . . 2.2 0.24 27.88 126.0 Vegetables and roots 2.02 0.4 9.77. 51.6 Fresh fruits (apples) .... 0.41 - 18.57 77.9 Sugar and sweets - - 70.53 289.2 Vegetable oil . . . - 2.84 - 26.4 Margarine .... 8.51 - 79.1 Tea ....... 0.7 - - - Dried fruits . . 0.16 - 4.49 19.0 8 1.14 1.86 2.54 32.4 Total of plant products 1 197.7 39.33 16.75 368.85 1828.9 Meat and meat products ... 8.6 10.01 - 128.3 Fish products .... 9.28 0.29 - 40.7 13.08 15.24 15.72 260.0 Butter 1v 0.15 13.07 - 122.2 4.15 0.18 0.65 21.3 1.2 4.47 - 46.5 5.92 5.74 0.25 78.7 2.37 3.03 0.36 39.4 Total of animal products 41.75 52.03 16.98. 737.1 i Total ... 1888.7 84.08 68.78 385.83 256.60 ! in the newspaper "Izvestiya TsIK USSR and VTsIK" of October 4, 1930, issue No. 274: "In order to ensure schoolchildren have hot breakfasts... the Council of People's Commissars of the RSFSR resolves: 1. To propose to the regional (provincial) executive committees and Councils of People's Commissars of autonomous republics, at the expense of the food products available in the region, province (or autonomous republic), to establish programs for additional nutrition of schoolchildren with hot breakfasts. In this case, the task should be set to provide hot breakfasts to all schoolchildren and, in any case, to no less than 70% of schoolchildren in cities and industrial points listed in lists J* 1-2, 50% in other cities and 70% in state farms (i.e., on average not less than 60% of schoolchildren in cities and state farms). Breakfasts should correspond to the approximate norm of nutrition established by the People's Commissariat of Trade of the RSFSR, and this norm can be changed depending on local conditions. 2. To propose to the People's Commissariat of Trade of the RSFSR, Centrosoyuz and Vsenkhoz to urgently instruct the relevant local authorities to allocate food product funds for the additional nutrition of schoolchildren from available resources, as well as kitchen and dining room equipment. 3. Hot breakfasts should also be provided to schoolchildren in rural areas. For this purpose, to propose to the regional (provincial) executive committees and Councils of People's Commissars of autonomous republics, when establishing the nutrition program for rural schoolchildren, to provide that food product goods, in particular sugar, should be allocated from available resources." This resolution gave a powerful impetus to the development of the network of school canteens, and at present in large industrial cities practically 100% of schoolchildren already receive hot breakfasts. When organizing a school canteen, it should be borne in mind that in the absence of a special canteen accommodating all schoolchildren, children should be admitted in groups. For faster admission of the entire school contingent, the serving of hot breakfasts should be carried out as is done in factory canteens. Certain shifts come to the canteen at a certain time on the bell, take their designated places at designated tables where breakfast is prepared. With this order, the canteen is freed to admit the next group within 20-30 minutes. Attention should be paid to the fact that school breakfasts should preferably be organized no earlier than two, and no later than four hours after the start of classes. Norms for school hot breakfasts are given in table 11. In view of the fact that a significant part of schools, at least in cities, operates in two shifts, the question arises of the need to provide children with lunches at school. With regard to lunches, all the organizational measures mentioned above should be adopted. Lunches should preferably start no earlier than two, and no later than four hours after the start of classes. In each individual case, it is necessary to consider and coordinate with the school administration the question of those subjects that take place after lunch. Tabl. 10. Daily ration for pioneers. Quantity of digestible nutrients (in g) Quantity of cal. of products 2s proteins fats carbohydrates Rye bread . . 2)0 10.51 1.02 76.0 361.4 Wheat bread 22.5 1.14 141.6 695.7 Wheat flour 1.51 0.15 11.25 53.7 Potato flour . . . 0.07 - 7.33 30.3 Cereals and legumes '66 6.64 1.14 42.48 212.1 0.32 0.05 4.47 20.1 Macaroni .... 0.93 0.05 7.33 34.3 Potato .... 2.75 0.3 34.98 157.5 Vegetables and roots 2.43 0.48 11.73 61.9 Fresh fruits (apples) .... 0.41 - 18.57 77;9 Sugar and sweets - - 70.53 289.2 Vegetable oil . . . - 2.81 - 26.4 Margarine .... - 8.51 - 79.1 0.7 - - - - Dried fruits . .. 0.16 4.49 Total of plant products 1 405.7 48.26 15.68 433.76 2 121.6 Meat and meat products . . . 8.6 10.01 - 128.3 Fish products . . . 9.28 0.29 . - 40.7 13.08 15.21 15.72 240.0 Butter 0.16 13.07 - 122.2 4.15 0.18 0.65 21.3 1.2 4.47 - 46.5 Eggs ....... 5.92 5.74 0.25 78.7 Total of animal products 42.38 49.0 16.62 697.7 Total ... i 086.7 90.14 64.68 450.38 2 819.3 Loading a child after lunch with activities requiring significant mental strain is not advisable. Similarly, it is not recommended to conduct such activities as physical education. After lunch, it is best to arrange labor activities in some workshop. In addition to canteens existing in schools, special children's canteens are beginning to be built. At present, these existing children's canteens do not yet provide schoolchildren with a full daily ration, but this is a matter of the near future. It is possible that children's canteens will at the same time serve the child both during school hours and during his leisure time. The question of the territorial location of these canteens, their capacity, and the delivery of food in ready-to-eat form or in semi-finished products is practically still insufficiently illuminated. Apparently, products will be delivered from a central preparation factory to district canteens, and ready-made breakfasts, lunches, and dinners will be served here. Tabl. 11. Norms for school hot breakfasts for children from 8 to 13 years old. Name of products Quantity of digestible nutrients (in g) Quantity of cal. proteins fats carbohydrates Rye bread . . Wheat bread Wheat flour Potato flour . . Cereals and legumes, including rice Macaroni . . . . Potato . . . Vegetables and roots Berries and fruits (3) 2.64 3.68 0.28 0.03 1.87 (0.16 0.83 0.66 0.84 0.08 0.08 0.34 0.26 0.19 0.03 0.31 ( 0.02) 0.05 0.07 0.16 3.78 0.07 19.0 23.56 2.12 1.47 13.18 (2.24) 7.33 8.39 5.95 3.72 0.89 9.4 1.81 91.1 113.5 10.1 6.0 64.6 (10) 34.3 37.8 29.5 15.6 3.8 38.6 35.2 9.5 Dried fruits . . Vegetable oil or margarine.... Tea........ ю 4 1 5 Total of plant products Meat and meat products . . . Milk and dairy products (in milk equivalent) including: Eggs........ 25 33 (50) (4) (20) (6) S 11.37 ' 3.86 4.02 4.68 ( 1.64)-0.04) (2.76) (0.24) 0.36 4.92 2.33 ' 0.99 м (1.91 ) (3.27 ' (0.12 (0.89 ; 0.34 96.82 2.4 (1.97) (0.43) 0.01 489.6 37.4 25.6 86.6 (33.5) 30,6) 14.2) (9.3) 4.7 154.3 Total of animal products 268 615 12.92' 9.85 2.41 Total' . . . 24.39, 14.77 99.23 613.9 Layouts (with details). I'p r e r-n y e menus for different groups of child population. - In practical life, when working in nurseries, children's playgrounds, kindergartens, schools, when taking octobrists and pioneers to camps, questions constantly arise about daily norms and menus for these groups of child population. The Central State Scientific Institute of Public Nutrition of the NKZdr. and Vsekopit, on the basis of food resources allocated by Narcomsnab, developed norms, menus and layouts for child nutrition (see below-literature).
The tables provided (Tables 7-11) indicate the daily ration for children from 1 to 3 years inclusive, the daily ration for children in gardens and on playgrounds, the norms for school hot breakfasts, the daily ration for Octyabrata (Young Pioneers for younger children) going to camp, and the daily ration for Pioneers going to camp. Along with the daily ration, a weekly menu is provided for all these age groups, taken from a collection published by the Institute of Nutrition and approved by the People's Commissariat of Supply (pp. 111-114). Collection points for women's milk. Ensuring that infants receive women's milk is an extremely important task, since we do not yet have artificial mixtures that would not be inferior to women's milk in their dietary properties. Various institutions of a closed type (infant homes), as well as hospitals, in the vast majority of cases still make use of wet nurses. This method of obtaining women's milk is however not entirely convenient for institutions, and in recent years, as in Western Europe, so with us, collection points for women's milk are beginning to appear. At the State Scientific Institute for the Protection of Mother and Infant of the People's Commissariat of Health, such a collection point for women's milk has existed since 1928. The point operates on the following principles: healthy women who are breastfeeding their own children, or mothers whose children have died, are accepted to the collection point. Mothers are examined monthly by a therapist and gynecologist. An RW (Wassermann reaction) is performed once every 3 months. The doctor at the collection point monitors not only the health of the mother, but also the health of her child, requiring the mother to present the child's card from the consultation. Mothers express milk 3 times a day into sterile containers. Women's milk is not subjected to any procedures (boiling, sterilization, pasteurization) and is delivered to departments in its raw form, as well as dispensed to individual citizens by doctor's prescription. It is not advisable to use boiled milk, as observations (Serebrysky-Winner) have shown that boiled milk causes severe diarrhea in infants in the first weeks of life, i.e., in those children for whom it is of greatest value, very often. Therefore, it is hardly advisable to abandon the form of operation of collection points adopted by the Institute for the Protection of Mother and Infant and switch to collecting milk from various women without prior examination and dispensing it in boiled form. Mothers working at the women's milk collection point receive a full daily ration from the Institute. For milk expressed on weekends, mothers receive payment at one and a half times the rate. At the end of the expression period, they receive appropriate compensation for the leave. Lit.: Soc.-hyg. problem. Organization.-Agrarian question and peasant movement, published by the International Agrarian Institute, v. 1-2, M., 1929-32; Bardakh M., Results of the starvation of Germany and Austria, Odessa, 1922 (bibl.); Binstok V. and Kamikinsky L., People's nutrition and people's health, M.-L., 1929; Budgets of workers and employees in 1922-27 (Works of the Central Statistical Administration, v. 1-3, M., 1929); Didrikhson V., Health of the working people here and there, Ch. IV, pp. 69-86, L., 1932; Kabo E., Nutrition of the Russian worker before and after the war, M., 1926; Klepikov S, Nutrition of the Russian peasantry, M., 1920; Kozyminykh-Lanin P., Artel feeding of factory workers of the Moscow province, M., 1915; Peasant budgets 1922-24 (Works of the Central Statistical Administration, vol. XXXI, issues 1-3, M., 1926-27); Lenin, Development of capitalism in Russia: ibid., Agrarian question and Marxism; Molkov A., Social problems of nutrition, M., 1923; Okunevsky Ya., Labor and nutrition of the Red Army man,
Related articles
Cite this page
“Nutrition.” Soviet Medical Encyclopedia. English translation of Bolshaya Meditsinskaya Entsiklopediya, 1st ed. (Moscow, 1928–1936), ed. N. A. Semashko. https://sovietmedicalencyclopedia.pages.dev/article/nutrition/