Blood
Historical document, translated for reference. It reflects medical knowledge of the 1920s–30s and is not medical advice.
Summary
Blood is the fluid filling arteries, veins, and capillaries, consisting of plasma and suspended formed elements. It serves as the internal environment of the body, transporting nutrients, gases, and waste products while maintaining homeostasis through complex physicochemical processes.
Encyclopedia article (1928–1936)
BLOOD, the fluid filling the arteries, veins, and capillaries of the organism and consisting of transparent pale-yellowish plasma and the formed elements suspended in it: red blood cells, or erythrocytes, white blood cells, or leukocytes, and blood plates, or thrombocytes. In the phylogenetic series of animals, blood is first separated, though imperfectly, from the intertissue fluid simultaneously with the appearance of the circulatory system—in echinoderms and annelids; in the body of the human embryo, blood appears on the 3rd-4th week simultaneously with the rudiments of vessels and within them. Both these rudiments and the primary formed elements of blood originate from mesoderm (see Hematopoiesis).- Despite the fact that many authors continue to speak of 'blood tissue' with a liquid intercellular substance, the term 'tissue' cannot by any means be considered applicable to blood, which differs from any other tissue mainly in that the place of formation of its morphological elements and components of plasma is not in the blood itself, but outside it. Together with lymph (which, by the way, no one calls a tissue), blood represents the internal environment for all elements of our body, which all organs and tissues replenish with products of their vital activity, and some organs, such as bone marrow, spleen, lymph glands, etc. (see Hematopoiesis), also with the formed elements formed in them. The formed elements that have entered the blood continue to live and function in it as long as the structural changes caused by their activity or age do not reach such a degree as to make their capture and destruction by erythrolytic and leukolytic organs possible (see Hemolysis). The physiological disintegration of erythrocytes and leukocytes in the blood stream, admitted by some authors, still remains unproven, so in this respect too blood differs from all tissues of the organism. Blood differs from other parts of the internal environment, i.e., lymph and intertissue fluid, not only in composition and location in vessels, but also in its continuous and rapid circulation through vessels, caused by the activity of the heart (see Circulation). Passing through capillaries, blood comes into contact through their walls with a considerable part of the body's cells; where cells do not come into direct contact with capillaries, the connection between them and blood is established through the intertissue fluid washing them. In the lungs, where capillaries are covered only by the thinnest layer of alveolar epithelium, blood comes into close contact with the air in the alveoli. Throughout the entire extent of the enormous capillary network, there occurs a continuous exchange of substances between tissues and blood through the walls of capillaries. Into it continuously enter from the air and from tissues gases, water, inorganic and organic compounds that are products of the digestion of food substances, internal secretion of tissues, dissimilatory processes, vital activity of bacteria that have entered the organism or inhabit it, etc. All these substances are carried by the blood stream to all parts of the body and on corresponding sections pass again from blood into tissue cells, which, depending on circumstances, are for them nutritive material, stimulating, inhibiting or poisonous agents, or material accumulating as reserves, or finally for excretion from the organism. In combination with the aforementioned rapid turnover of blood, this forces us to recognize it, along with the nervous system, as the most important factor maintaining the unity of the organism and determining the interaction of its countless constituent elements, which in the process of natural selection has reached a perfection of coordination amazing in its perfection. The same exchange of substances between blood and tissues, in combination with circulation, determines, besides the function of connection, all other functions of blood, which are most closely intertwined with each other and with the functions of all sorts of organs and tissues of the body and in which it is possible to draw a line only very conditionally between the functions of tissue nutrition, removal of dissimilation products, oxygen supply, maintenance of the physicochemical properties of the tissue environment necessary for the vital activity of cells, its active reaction and osmotic pressure. In higher or less highly organized animals, all nutritive substances perceived by them from the external environment are delivered from the digestive tract to tissues exclusively through the medium of blood. Its role is not limited here to one merely mechanical delivery of products of digestion to the places of their consumption: changes in its chemical composition and physicochemical properties are active factors both in the transition of these products into blood and in their subsequent transition from blood into tissues. Thus, the impoverishment of blood with sugar, the increase in the content of lactic acid and shifts in the electrolyte system cause in the tissues of a certain part of the body chemical processes proceeding in the direction of bringing the chemical constants of blood closer to the average normal (breakdown of glycogen with the release of sugar into the stream of outgoing blood, resynthesis of lactic acid with a decrease in its quantity in the outgoing blood, etc.). The same is true of those substances which, being products of vital activity or breakdown of some organs, are necessary for other organs to perform their specific functions: secretory or excretory functions, intermediate metabolism, etc.; and here the exchange occurs with the very active participation of the physicochemical mechanisms of blood. Finally, the numerous nutritive substances that have entered from the intestine into blood, before passing into tissues, undergo various transformations in the stream itself; partly under the influence of enzymes and formed elements of blood, partly through the medium of more or less labile compounds with its components, the products of digestion are transferred to a state allowing their further assimilation by the cells of the organism, or are freed from this or that toxic properties. Among the organs to which blood delivers the substances necessary for their specific function are also those through which all sorts of 'waste products' of the organism, products of dissimilation and breakdown, the accumulation of which in the organism could lead to harmful consequences for it, are removed. Here blood plays, along with the nutritive role, also a cleansing role, and in performing this function too the matter is not limited to one merely mechanical delivery, but is accompanied by a series of the most complex physicochemical processes occurring in the blood itself. The colloidal state of blood proteins and their osmotic pressure, the state of buffer properties of blood, the ratio of electrolytes in it and much else have decisive significance for the activity of any secretory and excretory organ, including kidneys and sweat glands, etc. Through the medium of blood also occurs all the gas exchange of our organism. Basically this exchange is caused by the differences in the tension of O2 and CO2 in the alveolar air and in tissues on the one hand, in arterial and venous blood on the other. But the process of exchange itself does not occur in the order of simple dissolution of gases in blood on some sections of the circulatory system and their excretion on others, but by their entry into labile chemical compounds with the components of blood. In the lungs O2 combines in this way with the Hb of erythrocytes, forming oxyhemoglobin; in tissues part of the CO2 entering the blood is bound by the bases of plasma, with which it forms bicarbonates, but part also remains in the free state according to the formula bicarb=nat K (constant). And since an increase in the content of CO2 in blood (as well as other acids coming from tissues) changes the aggregate state of hemoglobin and lowers its ability to bind O2 (Barcroft), then when blood passes through capillaries conditions are created that significantly promote the detachment of O2 from oxyhemoglobin and its transition to tissues. The reverse process takes place in the lungs, where the content of free CO2 in blood sharply falls, the ability of Hb to bind O2 increases due to this and thereby facilitates the formation of oxyhemoglobin; in the same direction also acts a number of other factors (occurring under the influence of fluctuations of free CO2 the movement of chloride ions from plasma into erythrocytes and back, the thickening of blood in the arterial part of capillaries and its thinning in the venous, etc.). All this shows that in the function of gas exchange, as well as in other functions of blood, all its components take an active part and that all the elements of this process are in the closest connection and constant interaction with each other. The normal functioning of any living cell is conditioned by a certain physicochemical state of the environment surrounding it, relatively small changes in which already lead to a disturbance of the cell's vital activity. Highly differentiated cells of higher animals, immersed in the 'internal environment' separated from the external world by numerous barriers, are especially sensitive to changes in the environment, in which blood plays the main role thanks to its mobility. Hence the biological necessity of the constancy of the main components and properties of blood, of which here can be mentioned the constancy of its active reaction (pH), osmotic pressure, composition of electrolytes.
And since the direct current of substances passing through the Blood, on the one hand, and a number of processes occurring in its own constituent elements, on the other, act in directly opposite directions, then in the process of natural selection there arose many adaptations that automatically neutralize all these harmful influences, equalize individual fluctuations, and limit their range within certain limits. Thus, in relation to the pH of the blood, the main regulating factors are the carbonates and other buffer mixtures contained in its composition, as well as proteins and Hb (see Buffer properties) that possess buffering properties. The activity of the lungs and kidneys also provides essential help, reacting with changes in ventilation and excretion to the slightest changes in pH and the acid-base balance of the Blood. The liver (through the ammonia cleaved from amino acids in it), numerous digestive glands that excrete acidic and basic ions from the Blood with their secretion, and a number of other organs also participate in this regulation. The constant level of osmotic pressure in the Blood is maintained mainly by the kidneys, as well as by the lungs and sweat glands. The ability of the loose connective tissue to quickly absorb and release into the Blood significant amounts of water and salts also plays a significant role; colloids of the Blood (due to their ability to bind water) and the height of blood pressure, caused by the dilation or constriction of blood vessels, as well as endocrine glands, etc., also participate. Finally, the ratio of electrolytes in the plasma, which has enormous significance for the activity of all body organs, is regulated in approximately the same way. The autonomic nervous system plays an enormous role in all these regulations, being extremely sensitive to fluctuations in pH and electrolytes and responding to these fluctuations with appropriate reflexes to various organs: lungs, kidneys, glands, vessels, etc. The content of formed elements in the Blood of a healthy person is characterized by significant constancy. This constancy is especially clearly evident in relation to erythrocytes; if those physiological fluctuations that are observed when counting them in the peripheral Blood at different times of the day, after drinking, movement, etc., depend in part on the actual change in the circulating mass of Blood in the body (see below - mass of blood), then the number of erythrocytes under certain standard conditions (on an empty stomach, with complete bed rest) appears to be a value that is largely constant for a given individual. At the same time, like all other constants of the Blood, the content of erythrocytes in it represents a dynamic result of continuously occurring oppositely directed processes in the body - in this case, the processes of formation and breakdown of erythrocytes. These processes are in the closest interaction, mutually stimulating or inhibiting each other. It is known that an increase in hemolysis leads to enhanced blood-forming activity of the bone marrow, and stimulation of the latter - to increased hemolysis, that suppression of erythrocyte breakdown is accompanied by a decrease in erythropoiesis and vice versa; however, due to the insufficiency of our knowledge about the breakdown of erythrocytes and the further fate of the products of this breakdown (see Hemolysis), as well as about the maturation of erythrocytes and their transition into the Blood (see Hematopoiesis), the very mechanism of interaction between these processes remains unclear for now. Apparently, the stimulating effect exerted on the bone marrow by the breakdown products of Hb and the stroma of erythrocytes plays some role in this. Endocrine glands, in particular the thyroid and sex glands, as well as the spleen, undoubtedly participate in the regulation of the composition of the red Blood; the gas exchange of the body has a great influence on the composition of the blood, and in recent years the role of acid-base balance has also begun to emerge. Finally, the importance of nutrition in maintaining the normal composition of the blood is becoming increasingly evident, and it is no longer a matter of iron alone, as it was still relatively recently, but of more complex animal and plant products, for example: amino acids, extractive substances, vitamins, etc. The regulation of the content of leukocytes in the Blood is even less studied and much more complex. Indeed, the total number of leukocytes is less constant than the number of erythrocytes, but all the more striking is the stability with which each individual maintains a certain ratio between the different types of white blood cells, the so-called leukocyte formula (see). Similarly to what we saw in relation to erythrocytes, here too the interaction between breakdown and regeneration apparently plays a major role; however, the multiplicity of forms of leukocytes forces us to assume the presence of a much more complex regulatory mechanism here. The lack of a final resolution on the question of the multiple or single origin of the various leukocyte species (see Hematopoiesis) considerably hinders the clarification of this mechanism. In addition, the study of the regulation mechanism is complicated here by the inherent active mobility of white blood cells and the chemotaxis and tropisms manifested in this, as well as by the significance of leukocyte reserves in the spleen, lymph glands, bone marrow, etc., which play a much greater role in relation to circulating leukocytes than the corresponding reserves of erythrocytes. Numerous facts testify to the influence on leukocytes of the chemistry of the Blood, the activity of endocrine glands and the autonomic nervous system. However, no definite regularities have yet been established here. - Finally, one cannot but note the persistence with which the total mass of Blood is maintained in the body. In different individuals it varies within quite a significant degree and both in its absolute and relative expression (see below - Total mass of Blood). But in each individual, the absolute mass of Blood [i.e., the sum of circulating and reserve Blood (see Circulation)] represents a very stable value, showing only minor physiological fluctuations in connection with drinking, movement, etc. It remains largely unchanged even in various pathological conditions: both in emaciation and in obesity (hence the increase, resp. decrease of its relative figures), in anemia (the loss of erythrocytes is compensated by an increase in plasma), after hemorrhages. The very mechanism of these regulations remains unknown for now. The special place occupied by the blood in the general economy of the body as its internal environment, and the peculiarities of its physiology described above, also determine the peculiarities of its pathology. Since the blood is not a tissue and does not possess either a definite structure or multiplying and developing elements within it itself, among its pathological changes there is no place for any processes associated with the existence of tissue as such: in it neither inflammatory phenomena nor atrophy or hypertrophy, nor tumors, nor impregnation or infiltration, nor finally necrosis or gangrene are observed. Pathological changes that in one way or another resemble any of these processes (leukocytosis-inflammation, leukemia-tumor) are in reality only a reflection of the corresponding processes occurring either in the blood-forming organs or in other parts of the body. Even the degenerative phenomena observed in the formed elements of the blood arise in the vast majority of cases not during the time these elements are in the Blood, but before their entry into it, in the blood-forming organs. The most diverse changes in the picture of white blood, all kinds of leukocytoses, lymphocytoses, shifts to the left or right (see Leukocyte formula), aleukias, agranulocytoses, lymphatic, myeloid, monocytic, myeloblastic leukemias, etc., depend not on the change or pathological growth of the elements circulating in the Blood, but on pathological changes in the leukopoietic and lymphopoietic organs, on the strengthening or weakening of their functions under the influence of various kinds of influences. The vast majority of anemic conditions also depend on disorders of the activity of erythropoietic or erythrolitic organs caused by various reasons, either in the direction of strengthening or weakening; the same applies to hyperglobulinemias of different origins. An exception to this rule are those diseases in which the formed elements of the Blood are destroyed or damaged in its current by harmful agents that have penetrated into it. These include such parasitic diseases as malaria and some others (see below - parasites of the Blood), septicemias with hemolytic agents, poisonings with hemolytic, damaging hemoglobin of erythrocytes poisons (CO, KNO3, aniline). Here can also be included the hemolysis of erythrocytes in paroxysmal hemoglobinuria (see), caused along with other factors by the presence in the Blood of a hemolytic ambocyte. Harmful or destructive effects on the formed elements circulating in the Blood are also exerted by some physical factors, such as overheating (sun baths), X-rays.
Depending on their intensity and duration of action, these and similar factors can lead to various changes in the composition of B., as well as physicochemical and morphological changes in the formed elements themselves; however, even in this case, we will not encounter reactions in B. similar to those observed in tissues with analogous damage or destruction of their elements. The only active reaction that can be observed from the circulating formed elements in this case is phagocytosis by leukocytes of infectious agents and damaged corpuscles or their fragments; however, the regeneration of formed elements does not occur in B. itself, but in the hematopoietic organs, stimulated by the breakdown products of damaged corpuscles, lack of oxygen, or other unknown pathways. If infection, toxins, poisons, etc. have paralyzed the activity of these organs as well, then the composition of B., left to its own devices, will more or less rapidly deteriorate until the onset of a fatal outcome. To an even lesser extent can we speak of endovascularly caused pathological changes in plasma. If we do not consider the small influence exerted by leukocytes on the content of enzymes and immune bodies in it, then all pathological changes in both the chemical components of plasma and its physicochemical properties (changes in the composition of electrolytes, lipoids, bilirubin, urea, residual nitrogen, phenols, sugar, acetone, alkaline reserve, rare changes in pH, changes in coagulability, etc.) are determined by the activity of all sorts of organs and tissues of the body, which either secrete pathological products into B. or normal products but in pathologically altered amounts, or do not remove from B. in a timely manner and in sufficient quantities the products of metabolism, or do not supply B. with necessary substances. All this also applies to the pathological changes observed in genotypic diseases of B., which are in reality either diseases of the hematopoietic organs, or organs regulating hematopoiesis, or finally organs supplying B. with any substances necessary for its normal state. Thus, for example, in hereditary hemolyic jaundice, the locus morbi is either in the bone marrow, which releases pathological erythrocytes into the blood, or in the spleen, whose hemolytic function is excessively strengthened: malignant anemia, a significant part of which is genotypic, is caused by improper function of the bone marrow; finally, the lack of coagulation of blood in hemophilia apparently depends on the insufficient entry of thrombokinase from tissues. The situation is exactly the same in some cases of chlorosis, where there is an endocrinologically caused insufficient function of the bone marrow. In view of these peculiarities of B. pathology, it can be stated that pathological changes in B. are only symptoms of diseases of other organs or tissues. Diseases of the central nervous system and especially of the vegetative centers regulating metabolic processes, dysfunctions of the endocrine glands, diseases of the kidneys, liver, pancreas, digestive and respiratory organs, disorders of blood circulation due to anatomical changes or functional deficiencies of the heart and blood vessels, all sorts of inflammatory processes, suppurations, etc.—in short, any pathological change in any part of the body is reflected in one or another chemical component of plasma, in its physicochemical properties, in the number of formed elements contained in B. and in their qualitative characteristics. B. thus appears as a kind of 'mirror of the body,' in which all the physiological and pathological processes occurring in it find to some degree their reflection. Hence the enormous and unflagging interest with which the smallest, seemingly, details concerning B. are studied (see Hematology) and in particular its physicochemical properties. It is necessary, however, to warn against the often observed purely mechanical view of the connection between B. and the rest of the body, according to which the reflection must exactly 'copy' the morphological and physicochemical changes of organs, as well as against the conclusions based on this same point of view regarding the functions of various organs. Proponents of these views overlook the extraordinary stability of the basic properties of B. and the multifaceted nature of its connections, due to which one or another effect on it may be neutralized as such, but can by various paths influence the less stable components or properties. For example, the introduction of salts will not noticeably affect the osmotic pressure of B., but will increase its water content and lower the level of erythrocytes and Hb; the introduction of acids within certain limits will not cause changes in the pH of blood, but will affect the alkaline reserve or lead to an increase in the number of erythrocytes, etc. Due to the antagonistic nature of the functions and regulations of the body and by no means absolute, although very perfect, their coordination, cases are also not uncommon when the result of some effect is paradoxical, when, for example, the introduction of sugar lowers its level in B., the entry of hemolytic substances leads to an increase in the number of erythrocytes, and suppression of hemolysis leads to a decrease in this number. In short, in relation to B., as in relation to other similar phenomena, the mirror-like nature should be understood not in the sense of identity between the reflection and the reflected, but in the sense of some correspondence between the reflected and the changes in the reflecting object. From all the foregoing it follows that when studying the effect on B. of the activity of any organ, one should: 1) take into account both the qualitative and quantitative state not only of this organ but also of B.; 2) not limit oneself to the study of only one possible direct effect (e.g., the content of lactic acid in B. during muscular work), but to capture the largest possible complex of elements of B. (alkaline reserve, erythrocytes, leukocyte formula, and many others), more or less related to the direct product of the activity of the organ being studied. And conversely, when determining the causes of one or another change in B., one should not limit oneself to searching for only one possible direct cause (e.g., hemolysis or bleeding in anemia), but always keep in mind the possibility of more remote and indirectly influencing factors (in this example—inadequate nutrition, toxic inhibition of the bone marrow, abnormalities in sexual life, etc.). Finally, one should always remember that all phenomena occurring in the body, and including those that cause changes in B. and its elements, represent a unity of processes mutually conditioning, stimulating, or inhibiting each other. Therefore, when elucidating the pathogenesis of one or another pathological phenomenon in B., one cannot limit oneself to establishing only one of its determining factors (e.g., the degree of hemolysis in anemia, changes in the protoplasm of erythrocytes with changes in their resistance), but should also reveal the corresponding opposite factor (the regenerative activity of the bone marrow, resp. the state of the nuclear substance in erythrocytes) and the nature and mechanism of the existing connection between these factors. In this, both the qualitative and quantitative characteristics of the factors and the mutual dependence of these should be taken into account, due to which the effect of any factor may turn out to be completely different if its intensity is different. Thus, for example, identical toxins, inflammatory processes, microorganisms in some cases cause leukocytosis, in others—leukopenia; such phenomena should always be foreseen in advance and their study included in the plan of the corresponding research when formulating the problem. Only when these methodological conditions are observed will the numerous contradictions that abound in the science of blood find their proper place and resolution, and which are one of the elements of the general crisis of medicine.
Y. Chernyak. P. Comparative Physiology of B. of Invertebrates. Since the definition of the concept of blood presents no difficulty in the case of vertebrates, it becomes problematic when attempting to encompass the relationships observed throughout the animal world, including invertebrates. The main difficulty lies in the fact that in defining the concept of B., it is necessary to take into account on the one hand the relationships between circulating fluids and hematopoietic organs, and on the other hand their relationship to the circulatory system. Furthermore, this definition is complicated by the need to clarify in each particular case the boundary between B. in the proper sense and lymph on the one hand, and interstitial blood fluid on the other. This difficulty is caused by the fact that not in all animals is there a topographical separation of the circulatory and lymphatic systems, and therefore not in all can a sharp line be drawn between blood and lymph. Indeed, in those cases where there is no separate lymphatic system or where it is represented by an unclosed network of vessels, the place of lymph is taken by tissue fluid circulating entirely or partly in lymphatic spaces and filling the body cavities. The simplest relationships are observed in coelenterates, in which there is not even a separation between the circulatory and digestive systems, and where the functions not only of digestion and circulation, but also of respiration and excretion are carried by the common gastrovascular system branching throughout the organism. Thus, in this class of animals there is no possibility to draw a boundary between blood and digestive fluid in the broad sense of the word, since in the gastrovascular system circulates sea water containing cellular elements of blood, and possibly also dissolved respiratory pigments and in addition oxygen, food particles, digestive enzymes, products of digestion and excretion, sex cells, and other cells. Thus, in coelenterates B. is in essence not separable from chyme and chyle. However, already in echinoderms the circulatory system is separated from the digestive system, and in connection with this B. acquires in them a more specialized and independent significance, although in this group too a strict boundary cannot be drawn between the fluids filling the proper circulatory system, as well as the water-vascular system and the general body cavity. However, the water-vascular system, whose main function is mechanical, apparently—at least partly—also carries out functions of gas exchange, as well as an excretory function. As one ascends in the animal kingdom, the isolation of the circulatory system and B. from other systems and fluids of the organism and their functions becomes more complete. At the same time, the gradual development of independent respiratory and excretory systems occurs. The process of functional specialization of blood apparently occurs very gradually, and in some echinoderms, which on the one hand have an independent circulatory system, and on the other hand have hemoglobin-containing erythrocytes, the latter are not contained in the circulatory system but in the water-vascular system, where due to the direct connection with the external environment the conditions for gas exchange are more favorable than in the circulatory system itself. Thus, the water-vascular system, containing a fluid colored by hemoglobin, carries the respiratory function and is analogous to the lesser circulation in vertebrates, while the circulatory system, distributing throughout the organism products of absorption from the intestine, corresponds to the lymphatic system of vertebrates. In this case, the first to occur is the separation of the digestive system from the circulatory system, while the connection of the latter with the general body cavity, as well as with the excretory and sexual systems and their functions, is still preserved at relatively high stages of the phylogenetic system; for example, the general body cavity of worms of the genus Sipunculus is completely separated from the digestive system, but in the absence of a specialized blood system it carries the functions of the latter, and at the same time, along with the function of respiration, it also carries out excretory functions. In this respect B. of sipunculids is especially remarkable. Besides true nucleated erythrocytes containing Hb, it also contains typical lymphoid cells of blood fluid. In addition to this, it also has peculiar urns, which are single-celled hollow cups with a ciliated edge, moving rapidly in the body cavity. The functions of these urns are very diverse. Possessing active mobility, they set in motion the entire mass of erythrocytes, which due to their high specific gravity would constantly settle to the bottom of the body cavity. Since sipunculids lack a heart and any contractile vessels, it is believed that the activity of the urns replaces them in this respect, and by keeping the erythrocytes in constant motion, it promotes their gas exchange (Cuenot). On the other hand, it has been established that from the opening of the urns a mucous substance is secreted, enveloping foreign particles that come within their sphere of action. Subsequently, all such particles are drawn into the cavity of the urn, where they are digested. Thus, the urns are definitely excretory elements, freeing the organism from products of decay. In this respect they can be considered analogous to nephrostomes, i.e., immobile excretory funnels of other annelid worms. Since the urns serve not for expelling particles to be removed from the organism, but for digesting them, they are also analogous to phagocytes (Cuenot, Cantacuzene). Finally, it should be noted that in the same body cavity the sexual elements are also suspended, passing through all stages of their development right here. Only starting from mollusks and arthropods does the final isolation of the circulatory system from other systems of the organism occur, its liberation from all extraneous functions and its specialization in gas exchange. The respiratory pigments of vertebrates are colored red and are associated with erythrocytes. In invertebrates, red pigments corresponding to Hb are encountered very rarely, whereas in them pigments (yellow, brown, greenish, and blue) are encountered, and moreover in invertebrates they are associated with erythrocytes only in rare cases, but mostly dissolved in the blood serum. In addition, it should be noted that the colloids of the blood fluid of mollusks and arthropods are in a hydrosol state and thus correspond less to the serum proteins of vertebrate blood than to hemoglobin (Bottazzi; 1922). This circumstance also accounts for the difference in some physicochemical properties of B. of vertebrates and invertebrates. In view of the fact that in the latter the respiratory pigments are dissolved in the blood serum, the latter is incomparably richer in protein substances than the plasma of B. of vertebrates. Therefore, the figures relating to the serum of vertebrates cannot be compared with the corresponding figures found for invertebrates, since in many cases, for example in mollusks and crustaceans, the protein content in one liquid part of B. corresponds to its content in the whole B. of vertebrates.-- As for the mineral composition of B. of various animals, it should be noted that in marine invertebrates the mineral composition of B. is very similar to the mineral composition of sea water. Data on the circulatory system and blood for individual classes. Sponges (Spongiae) and coelenterates (Coelenterata). They do not have a specialized circulatory system. The latter is represented by the common intestinal cavity system, which is filled with a non-coagulating colorless fluid containing a small amount of granular leukocytes. In chemical composition their B. is close to sea water (A of sea water 2.2°C, A of gastrovascular fluid 2.195°C). In many coelenterates the gastrovascular fluid is free from protein substances and does not contain respiratory pigments. Oxygen from the water is absorbed directly by tissue cells. In other representatives of this group the respiratory pigment tetraerythrin has been found (Merejkowsky; 1881). The granular formed elements, which have been very little studied, in general are quite comparable to the corresponding cells of higher groups. From a phylogenetic standpoint it is important that wandering cells appear in the cavity fluid already in those animals in which blood in the proper sense of the word does not yet exist, i.e., when B. is essentially sea water not containing colloidal substances. Echinoderms (Echinodermata). Along with the body cavity and water-vascular system, they have a separate circulatory system, of which the latter two are filled with fluid of the same composition—transparent, colored or colorless, containing 1-2% coagulable albuminoids, a large number of granular ameboid cells supplied with a yellow or violet pigment, which apparently does not carry respiratory functions. The granular cellular elements apparently carry phagocytic-excretory functions. In some echinoderms (Ophiuroidea) anucleate erythrocytes of size 1/4-20 μ have been found, of yellow-pink color, which in mass gives a red color to B. The pigment of the erythrocytes gives two absorption bands of oxyhemoglobin, but in view of the fact that crystals of hemin have not yet been obtained from it, it cannot be identified with certainty with Hb and assigned respiratory function to it (Foettinger, 1880; Ludwig-Hariann, 1901).
In sea urchins, along with unpigmented amoeboid cells, there are cells with a red-brown granulation, caused by the presence of a special pigment - echinochrome (Mc Munn; 1885, 1889), which is apparently an iron-containing lipochrome, to which some authors attribute a respiratory function (Gedder; 1880). The composition of echinochrome is determined as C102 H99N12FeS2 O12, and it has been noted that by boiling with mineral acids it can be converted to hematoporphyrin, which indicates its relationship to Hb (Griffiths; 1892). Other authors consider these data insufficiently proven (Winterstein, 1909; Bottazzi, 1922). In some holothurians (Echinodermata), in addition to non-granular and granular (oxy- and baso-philic) leukocytes, erythrocytes are also found with a diameter of up to 30/μ, containing a red pigment, apparently fully corresponding to Hb both chemically and spectroscopically. This Hb differs from that of vertebrates only in a lower coagulation point (58-60°C) (Howell; 1885). From the point of view of comparative physiology, the process of coagulation of the blood of echinoderms is extremely significant; in this case, a very characteristic agglutination of the formed elements of the blood is observed, which release long thread-like pseudopodia, by which they anastomose, forming voluminous "plasmodia." However, complete coagulation does not occur in echinoderms, but the precipitation of threads and the formation of a clot with very strong retractility is observed. In sea urchins, whole blood has a reddish-yellow color; after the clot precipitates, a layer of colorless plasma forms above it. In paraffinized vessels, coagulation does not occur. Attempts to find a soluble protein in the cavity fluid, analogous to fibrinogen, were unsuccessful; the coagulation process in echinoderms is probably associated exclusively with cellular elements, which, when entering the external environment, release pseudopodia, while secreting a coagulable protein substance, and possibly also an enzyme promoting this process (Bottazzi; 1922). Worms (Vermes). In the class of worms, which is very heterogeneous in its phylogenetic composition, the physiological relationships between the families included in it are extremely complex. In particular, the structure of the circulatory system and the body cavity, as well as the physiological nature of the fluids filling them, are very diverse and heterogeneous within this class. In flatworms, the structure of the circulatory system resembles the gastrovascular system of coelenterates. In round and segmented worms, along with the body cavity, there is an open circulatory system, while in others the circulatory system is completely closed. A closed circulatory system containing a red-colored liquid is present in many segmented worms, with the exception of the family Capitellidae, where there is no separate circulatory system and where the blood is the same as in other annelids and fills the usual body cavity. Red blood is also found in leeches (Hirudinea). The non-communicating circulatory systems and body cavity of segmented worms, including leeches, differ greatly in the nature of the fluid they contain. While the fluid of the circulatory system is colored red or green by the proteids contained in it, but with rare exceptions (Nemertini), it does not contain erythrocytes, the second contains an unpigmented fluid in which erythrocytes suspended in it are found, similar to the erythrocytes of mammals (Quatre-fages; 1850); thus, in morpho-physiological relations, the content of the circulatory system of worms is comparable to the blood of mollusks and arthropods, while their cavity, or perivisceral, fluid corresponds to the blood of vertebrates (Milne Edwards, 1859; Cuenot,1891); as for leukocytes, they are found in both systems. It should be noted that these relationships developed very gradually. This is evident from the fact that in some genera of the family Terebellidae, while having colored blood, the cavity fluid does not contain erythrocytes; finally, in the lowest representatives of this same family, there are no erythrocytes in the body cavity, but at the same time there is no special circulatory system with colored blood fluid. Leukocytes in worms are represented by several types of lymphocyte-like cells - mucous, fat-containing (oleocytes), vacuolated lymphocytes (cellules adipos-spheruleuses). In the body cavity of all worms, so-called chloragogen cells, filled with green-colored secretion, also float. These cells, probably detached from the wall of the body cavity, apparently perform excretory functions. The most mature forms of leukocytes are mostly provided with oxyphilic granulation (Kollmann; 1908). Leukocytes with protein, fat, and yolk inclusions, as well as with excretory grains, are found. All this indicates that they participate in vegetative processes. A very characteristic leukocyte-like element in some worms (Sipunculus, Phascolosoma) is the so-called urns (see above). The erythrocytes of worms appear as spherical formations containing nuclei with a diameter of 8-24 μ. In a thick layer, they give the blood a vermilion or carmine-red color; individually they have a color depending on the species - yellow-green or lemon-yellow. In all segmented worms, Hb similar to that of vertebrates has been chemically and spectroscopically detected. The ratio of the number of leukocytes to the number of erythrocytes is approximately 1:100 (Kollmann; 1908).- Chromoproteins. 1. The most widespread is Hb, causing the red color of blood and erythrocytes. 2. Chlorocruorin (CБ60H845. .N143FeS3O167)-a green pigment very close to Hb (Ce36H1025N164FeS3Ol81), found in many marine worms, gives two absorption bands between C and D and between D and E. 3. Hemerythrin (C427H7eiN135. .FeS2O153), a red pigment in Sipunculus (Gephyrea). In a fresh solution it has a pink color, it browns in the air. No absorption bands are detected; hemin has not been obtained from it; contains Fe (Griffiths; 1892). Coagulation. In worms, this process is generally similar to coagulation in echinoderms, both in the unproven presence of fibrinogen in them, and because the main moment here is the agglutination of leukocytes. Only in one form (Pliymosoma) does a voluminous transparent clot form, resembling the corresponding process in arthropods. Mollusks. The circulatory system of mollusks shows all transitions from the primitive lacunar system (Amphineura) to the highly developed arterial-venous system in cephalopod mollusks (Cephalopoda); the blood of various representatives of this class is no less diverse. The plasma of blood in mollusks is represented by a liquid containing globulins and colored blue, occasionally colorless, more rarely red or of another color. In the liquid part of the blood, leukocytes (amebocytes, lymphocytes) are suspended, which in both morphological and functional relations are fully similar to the amebocytes of other invertebrates, serving the purposes of phagocytosis, excretion, assimilation, and accumulation of reserve substances. The protein content in the blood plasma varies among different mollusks between 1%0 and 10%o. In qualitative terms, this is mostly globulins, of which the most significant is hemocyanin, a blue-colored protein containing copper (C867.H13fi3. O258NmS4Cu); mol. weight 18.762 (Griffiths; 1892); according to other data, its molecular weight is 16.642 or 21.700. Hemocyanin is a respiratory chromoprotein, being in this respect an analog of Hb. Comparative composition of hemocyanin and hemoglobin. Components Hemocyanin Hemoglobin (Limula) (ox) Melanin ....... Lysine........ AMiiNO-N-filtrates . Proline, hydroxyproline, tryptophan ..... 6.25 1.65 0.80 15.73 13.23 8.29 51.30 3.80 5.24 3.6 ? 7.7 12.7 10.9 57 2.9 In some mollusks instead of hemocyanin there is Hb partly in a dissolved state, partly bound to certain cells (Lamellibranchiata). Finally, many mollusks are completely devoid of chromoproteins. Hemoglobin forms upon crystallization of a dialyzed solution treated with (NH4)2SO4, crystals of oxyhemocyanin, the form of which varies for different mollusks. A similar hemocyanin has also been isolated from one crustacean (Palinurus). Oxyhemocyanin gives a clear absorption band in the region of the D line (A = 579 μμ; Krukenberg; 1882). In electrometric terms, hemocyanin is a negative colloid. For rabbits and guinea pigs it is not poisonous. Immunization of rabbits with hemocyanin leads to the formation of precipitins. The bond of Cu in the hemocyanin molecule (contained in it in an amount of 0.35%) appears to be much more labile than the bond of Fe in Hb. O2 content in hemocyanin: per 100 cm3 of an air-saturated hemocyanin solution (calculated per 1 g Cu) contains on average 135 cm3 O2 in mollusks and 224 cm3 in crustaceans (Quagliariello; 1922).
Comparative study of hemocyanins of different origins has shown that there is no direct proportionality between the copper (Cu) content in blood and its ability to bind O2. The physiology of hemocyanin still presents many unclear points. In particular, the natural equilibrium conditions between oxyhemocyanin and O2 are insufficiently studied, since direct experiments have shown that for decolorization of blood, i.e., for dissociation of oxyhemocyanin at t° 20-25°, almost a complete vacuum is required, whereas at 40-45° dissociation already occurs at a pressure of 250-300 mm. Thus, it is unclear how dissociation occurs in the mollusk's organism at its low body temperature. On the other hand, the physicochemical properties of various hemocyanins reveal a number of species differences. Hemoglobin, found in some lamellibranch mollusks, is generally similar to hemoglobin of vertebrates, differing however in some physical and physicochemical properties. Properties of Planorbis (mollusk) Human Absorption spectrum. Clotting time. λ=578 and 542 49° λ=581 and 545 69° The reason for the existence of hemocyanin in some mollusks and hemoglobin in other mollusks closely related to them is completely unclear. Uncolored proteins found in the blood of some mollusks apparently do not play a role in the respiratory process of mollusks, as was previously assumed. Enzymes. In the blood of mollusks, peroxidase, amylase, and zymase (Bottazzi) have been found. Clotting. The blood of mollusks does not contain fibrinogen and is not capable of clotting. When standing outside the organism, it forms the same cellular agglomerates as in echinoderms. Crustaceans. The circulatory system of crustaceans is almost entirely closed, and blood in them is a fluid rich in proteins and containing hemocyanin, as well as formed elements represented by various cells of the lymphocyte type, but differing in the presence, quantity, or absence of oxyphilic granules. Blood cells are capable of phagocytosis. Their granulation is associated with assimilatory activity, since during animal starvation (experimental or during molting) the granulation of cells sharply decreases. In addition, cells with large basophilic granules are found, to which an excretory function is attributed (nephrophagocytes; Bruntz, 1904). The blood of crustaceans is almost always colorless, transparent or slightly clouded by cells suspended in it. In the air it mostly turns blue, less often becomes red or violet, as for example in the river crayfish. When standing, it begins to give off a trimethylamine odor. Specific gravity 1.020-1.030; reaction is slightly alkaline. Protein content is very high (up to 57%). Blood clots, but true fibrinogen is absent. Chromoproteins: 1) hemocyanin, the amount of which varies greatly depending on the species, 2) hemoglobin, 3) lipochromes giving the blood a red-brown-yellow color. When hemocyanin and lipochrome are simultaneously present, blood becomes violet in the air. Only the first two chromoproteins carry the respiratory function, while the significance of the third is unclear; it is only known that it is related to the color of the shell. Enzymes. In the blood of crustaceans, proteases, amylases, lipases, diastases, oxidases, and tyrosinases have been found. Apparently, it also contains enzymes that promote clotting. Toxicity. The blood of crustaceans is not poisonous for guinea pigs, rabbits, and dogs. The frog is much more susceptible. The most poisonous effect of blood is exerted on other crustaceans. Clotting of blood in crustaceans is a very complex process, already fully resembling clotting of blood in higher animals and for the first time in the animal world playing a role in stopping bleeding. It proceeds in two phases: a) first, agglutination of cells occurs, b) then secondary clotting of plasma occurs. Agglutination proceeds with phenomena of strong cell changes, apparently secreting fibrin-ferment, under the influence of which around these cells, which are centers of clotting, precipitation of fibrin occurs. Thus, it can be thought that the clotting process is developed in the animal kingdom very gradually and that the form, phylogenetically the earliest, is agglutination of leukocytes. Tracheates (Latin Tracheata - arachnids + millipedes + insects). The circulatory system is not closed. Respiratory gas exchange occurs through the tracheae, as a result of which the circulatory system, with rare exceptions, is very rudimentary. Blood is colorless or colored yellowish or greenish. It contains ameboid cells: a) non-granular ameboid phagocytic leukocytes, b) granular leukocytes with small oxyphilic granules, c) cellules spheruleuses - cells with large spherical, slightly basophilic granules. In insects, in which the morphology of blood has been better studied than in other groups, large-granular cells are sudanophilic. Insect hemocytes are energetic phagocytes and play a major role in the phenomena of natural histolysis accompanying the process of insect transformation. Under experimental conditions, insect phagocytes show vigorous activity against bacteria introduced into the body cavity. The reaction of hemolymph, i.e., the liquid part of blood, is acidic or neutral (Poulton, 1890; Scholte, 1922). The amount of blood in adult insects is very small; in larvae it is significantly larger. Protein content in blood reaches 10%. When blood is dried, crystals of organic (uric acid, oxalic acid, tyrosine) and inorganic compounds precipitate. Clotting has been studied in insects extremely insufficiently, mainly due to the impossibility of obtaining a large amount of blood. Color of blood. Fresh blood is completely colorless or has a pale yellow, greenish, or reddish and even brown color. The green color of insect blood is caused by a pigment very close to chlorophyll. It comes from the chlorophyll of food and is present in blood in the form of dissolved metachlorophyll (Poulton, 1890; Geyer, 1913), giving a characteristic Brewster absorption band in the red part of the spectrum. In some cases, the green color of blood has nothing to do with chlorophyll and appears as a result of the action of tyrosinase. In addition, insect blood contains a number of lipochromes (zooneorhodin, zooxanthin, etc.). Color of blood by sex. Research on the blood of caterpillars and pupae has shown that in many cases the color of blood is characteristic of a certain sex; thus, in males it is colored yellow, in females - green (Geyer, 1913). With age, these differences weaken, and the blood of females gradually turns yellow. This feature is found not only in insects feeding on green plants (Lepidoptera), but as an exception in some predatory insects, for example in dragonflies. Exceptions are found however in the first group. Since the green color in females is caused by the presence of metachlorophyll, and the yellow color in males by the presence of xanthophyll close to it, it can be thought that this difference is caused by differences in the metabolism of males and females, which are connected with physiological peculiarities of the intestinal cells in both sexes. Possibly, the secretion of the sex glands also plays a role in this (Geyer, 1913). Apparently, the color of blood, as well as different tissues and organs, can mutate; thus, the butterfly Colias philodice, which normally forms bright green caterpillars, as a result of mutation gives caterpillars of blue-green color. The reason for the change is of a secondary nature and is not connected with the color gene (Gerould, 1921), but with the fact that the xanthophyll absorbed with food in the intestine begins to decompose and ceases to enter the blood. There is an observation that the blood of females more strongly reduces organic pigments than the blood of males (Dewitz, 1912). Enzymes. In the blood of insects, oxidative enzymes (tyrosinase) play a major role. Their action is manifested in the fact that when hemolymph stands in the air, a blackening precipitate falls out of it (the phenomenon of melanosis) (Krukenberg, 1886; Federicq, 1896). In some insects, diastases and glucosidases have been found. In addition, it contains catalase, more rarely - peroxidase. According to the data of Battelli and Stern, water-soluble oxidases play a major role in the biology of insects, while water-insoluble oxidases, which form the basis of tissue respiration in vertebrates, play no role in insects (Battelli u. Stern, 1913). In some insects, blood plays a protective role. In these cases (for example in Coccinella, Meloe, Lytta vesicatoria), a poisonous liquid containing cantharidin and acting as a means of defense is forcefully ejected from an opening located at the joint of the thigh and tibia. This liquid undoubtedly corresponds to blood. In other cases, when liquid is ejected through the oral or anal opening, it is probably not blood, but a product of cellular secretion of special glands. Tunicates represent a special interest, being, as is believed, a form phylogenetically closest to vertebrates. Their circulatory system is relatively simple and not closed. Blood consists of liquid plasma in which numerous morphological elements are suspended. The latter are represented 1) typical amebocytes with the finest granulation, 2) amebocytes with fat inclusions, 3) amebocytes with large vacuoles, 4) amebocytes with orange inclusions (Cuenot, 1899).
Amoebocytes of tunicates carry phagocytic and digestive functions, and are apparently sites of deposition of reserve substances. - Properties of plasma. Plasma of freshly drawn blood is transparent, colorless, and has a neutral reaction, in contrast to the sharply acidic sediment. No clotting of the blood is observed, but here too agglutination of the formed elements occurs. When standing in the air, the plasma quickly turns blue, which is associated with the presence of cellular elements in it, namely -- leukocytes resembling mulberries in shape; these cells give a rapid and intense blackening with OsO2. The reaction of these cells is sharply acidic, which results in a dark red coloring under the influence of Methylrot, in contrast to the yellow coloring of the liquid plasma. An extract of these cells in distilled water gives a strong coloring in a black-brown color, which occurs not only in the presence of O2, but also in an atmosphere of H and CO2, and is therefore not a simple oxidation reaction. By filtering the browned liquid, a transparent acidic liquid is obtained, which slowly turns blue. Precipitation with acetone makes it possible to isolate a protein chromogen from it, which differs in its high content (from 8% to 10%) of vanadium K-Tbi (Henze; 1911-1913). The blueing of the colorless chromogen is based on its oxidation. The slow onset of blueing is explained by the acidic reaction of the medium, since in an alkaline medium oxidation occurs instantly. In view of the fact that in the blood of tunicates (Phallusia) it is not possible to detect the presence of loosely bound O2, it should be assumed that the vanadium chromogen plays the role of a catalyst, and its self-oxidation is prevented by the high content of SO3 in the vanadium cells, reaching 6% there (20 times more than in sea water). The mechanism of action of the chromogen consists apparently in the fact that, being a catalyst, it promotes the simple absorption of O2 dissolved in the water passing through the gills. The protein content in the plasma reaches up to 3%. Guaiac test for oxidase is positive.
G. Epstein.
III. Comparative morphology of Blood. Comparative morphology of Blood can be understood more broadly, having in mind the entire animal world in general, and more narrowly, considering it only within the framework of vertebrates. The question of the comparative morphology of blood in the latter has been studied in more detail. In a comparative sketch, one cannot separate Blood from connective tissue, with which it constitutes the internal environment of the organism. Between Blood and connective tissue there is a constant exchange of both cellular elements and liquid components (blood plasma, tissue fluid). All functions of Blood without exception are also inherent to a greater or lesser degree in connective tissue. Various functions at this time turn out to be either divided among specially differentiated elements or combined in various combinations in less specialized elements. It is not possible to establish any regularities here that are connected with the general evolution of the animal world, just as it is not possible for other histological elements. In terms of the degree of general differentiation of tissues of the internal environment of all animals, they can be divided into the following groups: 1) animals lacking Blood and coelomic fluid; 2) animals with coelomic fluid and blood vessels, communicating both with the coelomic fluid and with tissue lacunae, and 3) animals with a separated closed vascular system, not communicating with either body cavities or tissue fluid. The first group consists of sponges, coelenterates, and flatworms; the second-all arthropods, most mollusks, echinoderms, and some others; the third group is represented mainly by annelids, some mollusks (cephalopods), and vertebrates. In sponges and flatworms, mesenchyme, or intermediate tissue, is powerfully developed; in coelenterates it is less developed. In flatworms, the elements of mesenchyme are poorly differentiated and consist of sedentary cells. One cannot speak here of true free-moving cells (M. Prenant). In sponges (Metchnikoff, Kolman), there are already amoeboid moving cells (amoebocytes), perhaps even of two kinds. These cells are capable of phagocytosis, then they transport substances accumulating in their protoplasm from one place to another, and finally they also participate in the formation of skeletal parts (calcareous and siliceous spicules and spongin bars). In hydrozoan polyps, wandering cells containing the characteristic granulation of leukocytes in their protoplasm have also been found in the intermediate plate. In animals of the second group, there is both coelomic fluid and a vascular system, represented, however, only by a greater or lesser number of main trunks, from which Blood spreads through the lacunae and spaces of the interstitial connective tissue and from here communicates with the coelomic fluid. Thus, in animals of this group, there is no significant difference in the composition of coelomic and tissue fluid and Blood. On the contrary, in animals of the third group, i.e., mainly in annelids, some mollusks, and all vertebrates, coelomic fluid and connective tissue are everywhere separated by the vascular wall from the Blood circulating in the vessels. Therefore, in these forms, the morphological composition of vascular Blood differs from that of coelomic and connective tissue elements. In all invertebrates (with the possible exception of some sea stars), there are two main forms of moving blood elements, or as they are sometimes called, whole amoebocytes. Some do not contain grains in more or less basophilic protoplasm, mostly have a round nucleus, and have various sizes (from 5 to 15 μ). These are basophilic non-granular amoebocytes (fig. 1-3). Others-granular amoebocytes-have larger sizes (up to 20 μ) and specific, in most cases oxy- or amphophilic granulation; the nucleus of the largest of them is often polymorphic in many animals. In animals with a closed circulatory system (annelids), amoebocytes circulate in the vascular Blood, somewhat different from the coelomic ones, to which some authors (e.g. Lison) give the name hem-amoebocytes. However, there is every reason to consider hemamoebocytes as forms identical to the small non-granular coelomic (and tissue) amoebocytes (Zavarzin). The smallest non-granular amoebocytes are distinguished by more basophilic protoplasm (fig. 1-3) and are the least differentiated and least specialized forms (Kollmann, Romieu, Zavarzin, Lazarenko). Usually from them all other cellular elements of both blood and connective tissue are formed (fig. 2). They can give rise to larger non-granular amoebocytes, which at the same time are the most active phagocytes (fig. 1-3). On the other hand, from them also arise the granular amoebocytes through the accumulation in the protoplasm, which loses its basophilic properties, of specific granulation. Granular amoebocytes are much less active in terms of phagocytosis, but their number increases significantly in case of bacteria entering the body; thus, in some properties they resemble specific leukocytes of vertebrates. From basophilic amoebocytes, excretory cells also arise, accumulating urates in their protoplasm [for example in mollusks (Zavarzin)], and sedentary reserve cells [for example Langher's cells of mollusks filled with glycogen (Zavarzin)]. Granular amoebocytes often transform into reserve cells of a mixed protein and fat nature, either free [so-called eleocytes (fig. 3a) of annelids (Romieu)] or sedentary [cells of the fat body of insects (Lazarenko)]. In both of these cases, a combination of reserve and excretory functions is possible, because urates are present in both eleocytes and fat body. Of particular interest are basophilic amoebocytes as participants in regenerative processes occurring in connective
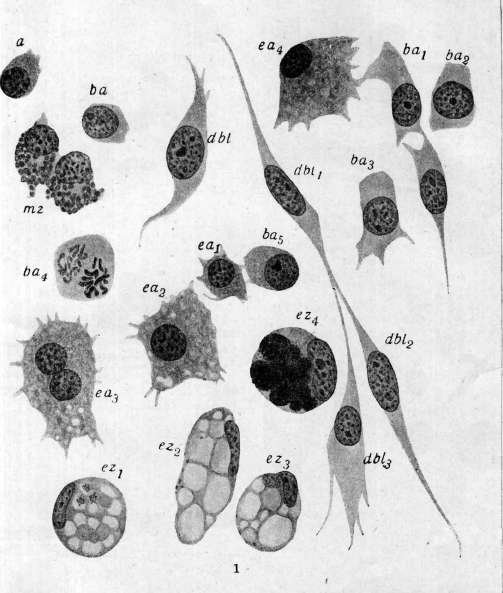
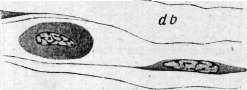
Figure 1. Cellular elements of blood and connective tissue of the mussel: a,ba-bc-bc-non-granular basophilic amoebocytes (ba, - mitosis); db,dbY - db3 - their transformation into desmoblasts (connective tissue cells); e1-ez-ez-excretory cells; mg-intermuscular granular tissue cells (cellules spheruleuses of Kolman). (After Zavarzin.)
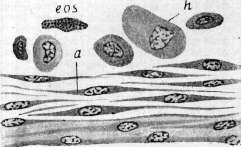
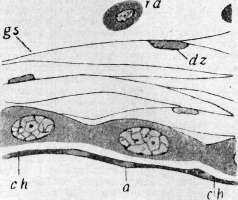
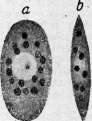
Figure 2a. Cellular forms of blood of the larva of the rhinoceros beetle: a-small undifferentiated form from the hematopoietic organ; b,c-non-granular amoebocytes; d,e-"round cells" (granular amoebocytes); f-eosinophils. Figure 2b-d. Formation of a connective tissue capsule around a foreign body in the rhinoceros beetle (three consecutive stages): a,db,dz-non-granular amoebocytes transforming into the ground substance (Os); h,ha-"round cells"; eos-eosinophil; ch-chitin. (After Lazarenko.) Figure 3. a,b-erythrocytes (b-in profile) of the annelid Pista cristata in fresh state (dark drops-fat); cd-non-granular amoebocytes of the same annelid; e,f-granular amoebocytes Perinereis cultrifera. Figure 3a. Eleocyte of Amphitrite rubra (light drops-fat; dark large grains-excretory granules) (After Romieu.) (Figures 2a-d, 3 and 3a see on the next inserted plate.)
2b
2d
f e
Щ § 3a 2c To the article. Blood. BLOOD
630 of connective tissue. Under certain experimental conditions, and in particular when a foreign body enters the cavity of an animal or into the connective tissue around this foreign body, a connective tissue capsule is formed. The formation of such a capsule occurs entirely (fig. 2b-a) due to basophilic amoebocytes, which spread out on the surface of the foreign body (the phenomenon so-called thigmocytosis), merge into a syncytium, and through the differentiation of protoplasm give rise to the formation of the ground substance. The vessel wall in invertebrates sometimes has an endothelium and sometimes does not. There are indications that both the endothelium and the vessel wall itself are formed from the same amoebocytes (Danini). It is very characteristic that where there are no settled cells in connective tissue (e.g., in insects), there the vessels also lack an endothelium. In many invertebrates, the blood contains respiratory pigments. Most often these are iron-containing hemoglobin, hemerythrin (red-yellow), chlorocruorin (green), and copper-containing hemocyanin (blue). The question of the colorless pigment achroglobin remains open and is more likely to be answered negatively. In cases of colorless blood, the pigment is either absent altogether or is represented by very weak concentrations of hemocyanin. The pigments are either dissolved in the blood plasma (many annelids, in particular the earthworm, some mollusks, and others) or are concentrated in special specialized cells, called by analogy with vertebrates erythrocytes (fig. 3). Erythrocytes in invertebrates are found both in the vascular blood and in the cavity fluids. Sometimes they are present only in the lymph of the cavity and are absent in the blood, more rarely the opposite is true. Erythrocytes are known in nemerteans, annelids, gephyreans, and mollusks. Their distribution is random. Sometimes of two closely related species [e.g., mollusks Solen legumen (Grisbach) and Solen vagina, annelids Polycirrus haematodes and Polycirrus caliendrum (Romieu)], one has erythrocytes and the other does not. Erythrocytes in most cases are nucleated, have not especially constant sizes, but a constant, usually round or oval shape. They are not capable of ameboid movements. Their protoplasm is filled with pigment (hemoglobin or hemerythrin) and often contains urates and fat as inclusions. Thus, invertebrate erythrocytes can also combine reserve and excretory functions. Very rarely (the only case is the annelid Magelona), erythrocytes can also be anucleate, the same as in mammals. These erythrocytes do not contain inclusions and are found only in the vascular blood (Romieu). The ancestral form for all the listed elements up to and including erythrocytes is a small non-granular basophilic amoebocyte, which, multiplying by mitosis, differentiates in various directions (fig. 1 and 2a). Mitoses are also found, although more rarely, in granular amoebocytes. Specialized cells (erythrocytes, eleocytes, excretory cells, connective tissue cells, etc.) usually no longer multiply and gradually degenerate. Multiplication occurs in the tissue, in the blood, and in the lymph of the cavity. The question of the existence of special hematopoietic organs in invertebrates remains largely open and in most cases is answered negatively. Lymphoid organs have been described in cephalopods, insects, and decapod crustaceans. Spontaneous foci of hematopoiesis have also been described, scattered in connective tissue (river crayfish, insects). True lymphoid organs consist of a connective tissue reticular stroma, in the loops of which multiplying by mitosis small non-granular basophilic amoebocytes are located. The differentiation of the products of their multiplication always occurs outside the lymphoid organs and probably by heteroplastic means. In many invertebrates (e.g., arthropods, mollusks, etc.), there are special phagocytic organs resembling lymphoid organs but containing only excretory-phagocytic cells (nephrophagocytes), which also originate from non-granular amoebocytes (see above).-In vertebrates, blood is separated from connective tissue both functionally and morphologically much more sharply than in invertebrates (including annelids). In connection with this, the cellular elements of both the blood and connective tissue are more differentiated. While invertebrates usually have only two main types of amoebocytes, in most vertebrates there are at least three types of leukocytes; in this respect, only insects approach vertebrates, having three kinds of amoebocytes. Besides erythrocytes in the vascular blood of vertebrates, non-granular leukocytes (lymphocytes, monocytes) and granular leukocytes, or granulocytes (eosinophils, special leukocytes, basophilic leukocytes) are distinguished.-The matter is clearest with erythrocytes. In the blood plasma of vertebrates, Hb is never present. Likewise, other respiratory pigments are not encountered. Erythrocytes of lower vertebrates have nuclei, while in adult mammals they are anucleate. In each given species, erythrocytes have much greater constancy of size than in invertebrates. The largest erythrocytes are found in amphibians and reptiles, the smallest in birds and mammals. The shape is oval in most nucleated erythrocytes (among anucleate ones in the llama and camel) and round in erythrocytes of most mammals and in some fish.-Another immobile specialized element of vertebrate blood is thrombocytes of lower vertebrates and blood platelets of mammals. Thrombocytes are small nucleated cells, somewhat resembling erythrocytes but devoid of Hb; the morphological significance of anucleate blood platelets remains completely unclear.-Leukocytes of vertebrates are by most authors divided into two large groups: granular and non-granular. These names are mainly valid only for humans and mammals, and in some vertebrates, leukocytes belonging to the granular group do not contain specific granules in the protoplasm (e.g., in many fish). Granular leukocytes are specialized forms incapable of multiplication. In animals with the most differentiated blood elements (birds, mammals), three types of granulocytes are distinguished: special, basophilic, and eosinophilic. In the vast majority, special leukocytes are usually encountered. These leukocytes either possess specific granules (mammals, birds, reptiles, amphibians, some fish) or lack them (some fish). The granules themselves are extremely diverse in different species: they are either neutrophilic and fine (dog, human, frog) or acidophilic and coarse (birds, reptiles, rabbit). Special leukocytes are particularly diverse in fish. Eosinophilic granulocytes represent a more constant form and are found in almost all vertebrates [except for many fish, in which leukocytes with large protein inclusions resembling the protein cells of crayfish and other similar forms are often found instead (see above)].- Eosinophils are usually few in number (2-5% of the total number of leukocytes), but in reptiles (in snakes), on the contrary, they are very numerous. Eosinophils are characterized by more constant granulation; it is always sharply acidophilic and larger than that of special leukocytes.--Less definite cellular forms are the basophilic, or mast leukocytes. In fish they apparently, with very rare exceptions, are generally absent. Moreover, mammalian basophils differ greatly from the basophils of birds, reptiles, and especially amphibians. While mammalian basophilic leukocytes (constituting about 1% of the total number) differ quite sharply from the so-called mast cells of connective tissue, the basophils of birds, reptiles, and especially amphibians have a different character. The blood basophils of amphibians cannot be sharply demarcated from the mast cells of connective tissue (Maximov), and the basophils of reptiles and birds may be immature myeloid elements (Kleineberger and Walter). In any case, under the name basophils in different vertebrates, non-identical forms are described. Lymphocytes of lower vertebrates (fish, amphibians, perhaps birds and reptiles) are cells 7-10 μ in size with a narrow rim of basophilic non-granular protoplasm and a round nucleus. They are undoubtedly undifferentiated elements capable of transitioning into various specialized forms by heteroplastic means. Recently (Maximov), they are even called hemocytoblasts (see below) rather than lymphocytes. These lymphocytes can arise from reticular cells and themselves, by increasing the plasma rim, give rise to monocytes and macrophages. There are indications (Alfeeva, I. Kraft) that fibroblasts can also arise from these lymphocytes. Thus, lymphocytes of lower vertebrates are very similar in their potential to the basophilic non-granular amoebocytes of invertebrates. In the blood they are always present in relatively large numbers. In higher forms and mainly in mammals, among lymphocytes, two forms can be distinguished: one, concentrated mainly in hematopoietic organs, called the large lymphocyte (lymphoblast, hemocytoblast), and another, formed in the lymph nodes and present in large numbers in the blood, called the small lymphocyte.
In most mammals (human, dog, horse) there are fewer lymphocytes in the blood (about 20%) than granulocytes, but in some animals (rabbit, etc.) they are in the majority (about 60%).-The question of monocytes is even more complex because at present it should be considered proven that part of the monocytes may have a histiogenic origin from connective tissue and represent rounded reticular and endothelial cells and histiocytes of loose connective tissue that have entered the bloodstream. Thus monocytes can have both a histiogenic origin and a hematogenic origin (from a large lymphocyte). In any case, monocytes are little specialized forms possessing considerable nephrophagocytic ability (macrophages).-In lower vertebrates (mainly in fish, partly in amphibians) all blood elements are less specialized; in addition, elements are found in these groups that are absent in other vertebrates. Besides the protein cells of fish mentioned above, pigment leukocytes are sometimes found here. In addition, excretory inclusions are sometimes found in the leukocytes of fish. All this brings the blood of fish closer to the blood of invertebrates. Hematopoiesis has been studied mainly in mammals (Maksimov) and amphibians (Drevina, Maksimov) and less in birds (Danchakova, Myasoedov). In relation to hematopoiesis, vertebrates present a sufficiently variegated picture. The main difference from invertebrates is that while in most of the latter the reproduction of cellular elements takes place in the blood (cavity) fluid itself, in vertebrates hematopoiesis is incorporated into connective tissue, into hematopoietic organs, and only mature forms usually enter the blood, with the possible exception of some fish and reptiles in which the reproduction and differentiation of cellular elements may occur in the vascular blood.
A. Zavarzin. IV. Comparative Data on the Blood of Vertebrates. Total blood volume. The most accurate results are given by the direct method of Welcker (1854) in the modifications of Müller and Abderhalden (Abderhalden, 1899, 1902; Müller, 1901, 1921). Since this method, based on the determination of the amount of Hb, gives its total amount not only in the blood but also in the muscles and other organs, it is not entirely accurate and gives errors up to 8% (the amount of Hb in the muscles is about 5% of its total amount). Indirect methods by introducing isotonic solutions of salt, dextrin, dyes, antitoxins, etc., into the blood, as well as determination by the formation of Hb-CO, give more accurate but also not absolute results, all the more so since the figures obtained are subject to strong individual fluctuations. The following figures give an idea of the total blood volume in vertebrates. A dog weighing 10,350 g contains 7.98-8.25% of its weight in blood; for a dog weighing 5,780 g the corresponding figures are 8.02-9.00%. The ratio of blood weight to body weight has the following values for some animals: lamprey - 5.2%, perch - 3.0%, frog - 5.7%, pigeon - 9.2%, mouse - 7.6%, rabbit - 5.5%, goat - 6.2%, cat - 6.6%, dog - 7.4%. For separate classes the corresponding figures are as follows: fish - 2.0%, amphibians - 4.8%, reptiles - 5.8%, birds - 8.2%, mammals and man - 6.8% (Welcker). All determinations of this kind have a very relative value, and fluctuations within one species are very great. Thus, in the direct determination of the total blood volume in 52 rabbits, the following figures were obtained. Average body weight 535 1,078 1,971 Percentage of blood weight 5.65 5.20 4.49 4.35 Average body weight 2,250 2,494 3,147 Percentage of blood weight 4.42 4.47 4.70 Attempts to derive general rules based on the surface or volume of the animals studied (Dreyer; 1913) did not lead to definite results. The dependence of the differences on the biological properties of the objects studied—their warm- or cold-bloodedness, their herbivorous or carnivorous nature—is also unclear. The question is further complicated by the fact that in all cases it is not possible to take into account the relationship between blood and lymph. Chemical data. When examining the chemical composition of one blood serum, it turned out that the differences within the class of mammals are small, but they are very great when examining whole blood, which indicates the existence of corresponding differences in the composition of erythrocytes. Thus, according to the content of Na2O, PaO5 and K2O, group I (man, pig, horse, rabbit), II (ox, goat, sheep) and III (cat and dog) are in the ratio 1:5:10. The erythrocytes of the horse, pig and rabbit generally do not contain Na, but are rich in K (4.489-5.250%); in other mammals the amount of Na is relatively large (ox 2.281%) and the amount of K is relatively small (0.720%). The differences in the amount of P between birds and mammals are very great (chicken - 7.510%, man - 1.870%). The ratio between the amount of erythrocytes and serum: man - 434.2:565.8; pig - 436.0:564.0; dog - 561.6:438.2; cat - 432.4:568.6; horse - 391.6:608.4; chicken - 391.5:608.5; at the same time, the blood of omnivores and carnivores is richer in erythrocytes (466.1%) than the blood of herbivores (363.4%); birds occupy an intermediate position in this respect (429.7%). The amount of solid parts and water in the blood depends on the ratio of the amount of serum and erythrocytes. In mammals the dry residue ranges from 214.1% (omnivores and carnivores) to 194.4% (herbivores); in birds it is 204.1%; in fish - 127.0%; in frogs - 10%. The relative amount of hemoglobin in different classes: mammals - 100; birds - 83.4; reptiles - 46.2; amphibians - 41.5; fish - 38.1 (Korniloff; 1876). Quantitative data: per 1,000 weight parts of blood contains iron, hemoglobin and hematine: man: 0.545-129.7-6.18; dog: 0.550-139.8-6.24; cat: 0.457-122.3-5.18; pig: 0.525-134.1-5.96; horse: 0.492-126.4-5.58; rabbit: 0.430-123.5-4.88; chicken: 0.466-102.4-4.93; frog: 0.425-101.2-4.82 (Preyer; 1871). In general, the blood of mammals is richer in Hb than the blood of birds, but at the same time birds (122.4%) occupy an intermediate position between omnivores and carnivores (152%) on the one hand and herbivores (116%) on the other. If the average content of Hb in the blood of mammals is taken as 100, it turns out that for omnivores and carnivores it will be 117.0, for herbivores - 89.6 (for non-ruminants - 94.7, for ruminants - 86.2), for birds - 94.3. The dependence of Hb content on sex in animals is in general the same as in man. Thus, in 1,000 parts of blood there is Hb in males and females: in man - 125.5-109.4; pig - 166.8-154.0; dog - 138.3-146.5; rabbit - 121.2-116.0; ox - 112.0-104.0; chicken - 122.6-91.6. Chemical composition of plasma and serum. Since the amount of fibrin, corresponding to fibrinogen, in plasma is 0.5-1% of the total mass of plasma, it can be assumed that the composition of serum and plasma is almost the same. The percentage content of water and solid parts in the blood in different classes of vertebrates is as follows: in mammals - 91 and 89, in birds - 93 and 66; in fish (with the exception of the eel) - also 93 and 66. The influence of sex on water content: men - 90, women - 90, bulls - 90, cows - 91; male cats - 90, female cats - 91. The content of mineral salts in serum is generally significantly higher in birds than in mammals, exceeding it by 12.5%, with the exception of Na, the amount of which in birds is lower than in mammals. It is possible that the higher Ca content in birds is connected with the formation of a calcareous shell. Protein is contained in plasma, resp. in serum, in amounts up to 75% of the dry residue. In terms of qualitative composition of proteins, significant differences are noted between different animals. Thus, the serum of warm-blooded animals contains all 3 kinds of serumalbumins (a, β, γ with corresponding coagulation points: 70-73°, 76-80° and 82-85°) with the exception of the horse, ox and sheep, in which a-albumin is absent and in which coagulation occurs only at 76-80°. In cold-blooded animals, only a-albumin is mostly present, with the exception of the eel, in which β-albumin is also present, and the shark (Scyllium catulus), in which only β-albumin is present. Globulins. 1. Fibrinogen, coagulating at 56°, is the same in all animals. The amount of fibrinogen in the blood per 1,000 parts of plasma is: in man - 4.2, in sheep - 6.0, in dog - 4.6, in horse - 4.5, in pig - 6.5 (Trendelenburg, Loewy; 1924). The average amount of fibrinogen per 1,000 parts of whole blood is: in man - 2.1, in pig - 3.60, in dog - 1.78, in cat - 2.03, in horse - 2.85, in rabbit - 3.75, in cattle - 6.03, in sheep - 3.80, in chicken - 5.85. In cold-blooded animals the amount of fibrinogen is very small (Nasse; 1842). The amount of fibrinogen per 1,000 parts of plasma: in man - 3.85, in dog - 3.09, in cat - 3.59, in pig - 6.38, in horse - 5.55, in rabbit - 5.97, in sheep - 5.13, in ox - 9.95, in chicken - 6.61. The plasma of man and carnivores is significantly poorer in fibrin than the plasma of herbivores and pigs. In the first group max. = 3.85% (man), in the second min. = 5.13% (goat). In males the content of fibrin is higher than in females. Content of urea and oxidized substances. Animal Content of fibrin in 1,000 parts of plasma Cat........ 4.39 17.92 4.10 4.55-5.09 3.49 8.21 3.29 4.31-3.51 2. Serumglobulin (paraglobulin) is present in cold-blooded and warm-blooded animals in the same amount. The ratio of the percentage content of albumins and globulins in the serum of different animals is as follows: Protein Warm-blooded animal Cold-blooded animal Difference Total protein Albumin .... Globulin .... 6.51 3.61 2.90 3.74 1.12 2.62 2.77 2.49 0.28 Dependence of globulin and albumin content on physiological state: Rabbits Normal . . . Starved (5 days) Protein in serum in % 6.70 7.70 (A) albumin (G)globulin 4.80 6.40 1.90 1.30 2.52 4.92 Thus, in rabbits the ratio between albumins and globulins doubled as a result of 5-day starvation, while in horses 24-hour starvation was sufficient to obtain an excess effect of 2.25 times. Content of non-coagulable N-substances. Content of residual N (average figures by Bang). Animal Residual N in blood In plasma (in mg %) Pig ........ Horse....... Sheep....... 27 23 35 35 22 19 26 37 26 17 30 36 15 14 . 20 29 General "so- (a) Urea (b) Ami- Animals hold noki- alb residual-N slates Mammals (average) .... 30.6 15.3 1.0 Man .... 6.0 3.5 Pig . . . . . 0.9 Dog ..... 1.4 Cat..... 0.9 Horse .... 0.7 1.4 0.9 Rabbit .... 0.9 Birds (average) 42.9 8.5 33.5 0.25 Chicken .... 33.0 0.4 Pigeon ..... 0.1 Fish: Shark ..... 4.0 Carp...... 0.4 According to the content of urea in the blood, different animals are distributed as follows: mammals 0.00328%, birds 0.0182%, bony fish 0.0238%, shark fish 1.8042%. Shark fish occupy the same exceptional position in relation to extractive substances. Animals Mammals (excluding man) ..... Man ....... Pig ........ Dog ........ Horse ....... Ox......... Sheep....... Birds: Chicken ....... Fish: Shark ........
Marine bony . » freshwater fish Creatinine Creatin 4,94 6,80 5,31 3,12 5,14 5,95 3,34 3,74 36,0 6,20 5,46 Uric acid 2,0 o o o o o 1,67 4,22 ? Thus, the blood of birds is incomparably richer in uric acid than the blood of mammals, which is connected with the fact that in the former, urine also contains mainly uric acid. Content of amino acids in the blood of different animals. N amino acids Animals Human 7,13 Pig . 8,43-10.90 Dog . 4,60-10.20 Cat . 8.68 Bull . . 6.58 Sheep . . 7.0 Animals Rabbit . Chicken . Shark . . Bony fish . . N amino acids 9.20 20.29 39.0 28.0 Content of NH3 in blood (in mg%). Mammals...............
3,94 »
1.47 Allantoin is absent in human blood; in the blood of cattle and pigs it is 0.78 and 0.57 mg%, respectively, which corresponds to the presence of this compound in the urine of the latter. Sugar and reducing substances are contained in different animals in the following amounts: in mammals-81 mg%, in birds-201 mg%, in amphibians-65 mg%, in fish-50 mg%. Within the same species, variations reach up to 100%. Thus, for dogs, figures from 79 to 162 have been found, but it is necessary to take into account the phenomena of emotional hyperglycemia in laboratory animals, which occurs under the influence of tying, fright, etc. (Cannon; 1911). Among mammals, the lowest sugar figures in blood are found in cold-blooded and ruminants (50-57 mg%), in non-ruminants this figure reaches 90 mg%. Fats, lipoids, cholesterol (content in blood in mg%). Neutral fat is present only in plasma, but not in erythrocytes. Fatty acids and cholesterol are distributed between them approximately evenly. The content of lecithin in erythrocytes is higher than in plasma. Pigments. The color of plasma or serum is more or less characteristic of different species. In horses it is lemon- or golden-yellow; in cattle-red-yellow; in rabbits and pigs-almost colorless. The color of plasma is due to the presence of pigments in it: lipochromes or luteins and bile pigments, especially bilirubin. Animal lipochromes-carotenoids-are close to plant lipochromes: alcohol-soluble xanthophyll (C40H56O2) and ether-soluble carotene (C40H56) (Willstatter, Escher; 1910). Complete or almost complete absence of lipochromes characterizes pigs, dogs, goats, rabbits, and guinea pigs. High content of lipochromes is characteristic of humans, cattle, chickens, pigeons. Usually either one pigment or the other is present; but if both are present, one usually strongly predominates. Thus, in humans and cattle, carotene predominates, in chickens-xanthophyll. Carotene is also found in horses; but it is completely or almost absent in sheep or goats. The amount of lipochromes varies widely within individual species and depends on the content of lipochromes in food; but it has been found that each given species of animal is characterized by the ability to pass from the intestine into the blood only a quite definite lipochrome. If cattle are fed food that does not contain the typical carotine for them but is rich in xanthophyll, the latter still does not penetrate into the blood. The reverse relationship has been found in chickens (Hyman, Mueller; 1916).-Bilirubin. There are very many data on the comparative content of bilirubin in different animals. Serum of dogs does not contain it. In the serum of pigs, sheep, goats, rabbits, and guinea pigs, only traces of it have been found. In cattle it is sometimes contained in fairly large amounts. In horses it is mostly 0.02%. Chemistry of erythrocytes. Average water content 62.5%. The content of mineral salts in erythrocytes varies greatly in different animals. Thus, for example, in pigs, horses, and rabbits, sodium is completely absent, while in cattle, goats, and sheep it is very abundant; in humans it is scarce. The reverse relationship is observed in the case of potassium. The content of P2O5 is very characteristic for different classes: 1.31% for mammals (1.902 for non-ruminants, 0.727 for ruminants), 6.685 for birds. The amount of iron is generally the same everywhere, averaging 0.154% Fe2O3. An exception are ducks (0.229% Fe2O3). It is possible that this is connected with their diving lifestyle, which requires large reserves of O2 in the blood.-Hemoglobin. In general, the content of Hb in birds (23.4%), if we do not count ducks, is lower than in mammals (31.8%). Percentage content Mammals Birds, including ducks Ducks alone Hematin .... Hemoglobin .... 0.111 1.26 31.8 0.115 1.30 27.1 0.160 1.82 38.2 Thus, there is no parallelism between the figures relating to the content of iron and hematin on the one hand and Hb on the other. It is possible that different hemoglobins contain unequal amounts of iron or that they are different in colorimetric relation. Different hemoglobins may differ from each other in their ability to crystallize, in the shape of crystals, in light absorption, and in resistance. Crystallization. Easily crystallize and are difficultly soluble oxyhemoglobins of rats, horses, dogs. More difficult to crystallize oxyhemoglobin of cats-Very difficult to dissolve and easily crystallize oxyhemoglobin of humans, monkeys, cattle, sheep, pigs, rabbits, pigeons, and fish (exception-herring) (Preyer; 1871); the shape of crystals in most mammals is rhombic, in squirrels-hexagonal, in pigeons-tetragonal, in hamsters-monoclinic. Reduced hemoglobins are more soluble and more difficult to crystallize. When crystallizing decaying blood, the nature of the crystals may be different; for example, in horses, instead of normal prismatic crystals of the rhombic system, hexagonal ones can also be obtained. Light absorption also definitely indicates the difference between different hemoglobins. The same results are obtained by studying their resistance to NaOH and CH3COOH (see table on p. 638-bottom). Data of elementary analysis of erythrocytes. Elements Animals H | N Fe Horse .... Cat .... Guinea pig Chicken . 54.68 54.57 54.60 54.12 59.47 7.07 7.22 7.25 7.36 7.19 17.40 16.38 16.52 16.78 16.45 0.66 0.57 0.62 0.58 0.86 0.46 0.34 0.35 0.48 0.34 19.74 20.23 20.66 20.68 22.50 Thus, for 1 iron atom in horses there are 2 sulfur atoms, and in dogs 1 atom; in chickens for 2 iron atoms-9 sulfur atoms. Formed elements. Erythrocytes. For the function of respiration, on the one hand, the absolute amount of Hb in the erythrocyte is important, and on the other-the area of its contact with the environment, since the binding of O2 occurs only on its surface. When comparatively studying animals of the same species, the difference between average numbers relating to individuals does not exceed a few percent, while the difference between individual erythrocytes of one individual can reach 40%. The amount of Hb in one erythrocyte varies for all animals around average figures 30.3-31.7×10⁻¹⁴ g. However, it should be noted that for carnivorous and omnivorous animals, generally higher figures have been obtained than for herbivores. Number of erythrocytes. Erythrocytes are present in all vertebrates except amphioxus (Amphioxus). Exact determination of their number became possible only recently, when it was found that previous authors working with the Thoma-Zeiss chamber fell into an inevitable error, because they did not take into account the circumstance that in different animals the rate of sedimentation of erythrocytes is not the same. Therefore, the counts of the number of erythrocytes in lower vertebrates proved to be especially inaccurate, since the higher the content of Hb in erythrocytes, the faster their sedimentation occurs.-The shortcomings of the Thoma-Zeiss chamber are avoided when using the Burker chamber. Animals Number of er in 1 mm3 Burker ythrocytes (in millions) Thoma Difference in% % Hb in blood one er. (in 10-12 g) Sedimentation rate in chamber on 0.1 mm (in sec.) Sedimentation rate in 1 minute (in mm) Frog ......... Pigeon ....... 0.452 2.80 5.43 6.65 5.85 7.32 6.20 6.51 13.10 1.068 3.69 4.99 8.21 6.35 8.19 7.01 7.01 13.92 16-18 14.6 15.2 14-16.6 16.9 12.1 14.3 11.6 11.7 8.5 322 54 26-35 25 21 19 19 18 7 50 56-79 9.3 99 103 148 0.375 0.120 0.076-0.107 0.088 0.065 0.061 0.058 0.041 Dog ......... Rabbit ....... Pig ......... On the surface of the erythrocyte. Therefore, it is assumed that in general small but numerous erythrocytes are characteristic mainly of animals with very intense metabolism, in contrast to animals with more sluggish metabolism, which are characterized by larger but less numerous erythrocytes. This relationship is however not a general rule. For humans and domestic mammals, the amount of Hb is a constant value, so that any fluctuations in the amount of Hb correspond to certain changes in the number of erythrocytes. For 1/1 mm2 of the surface of the erythrocyte of humans and domestic animals there are 32×10-14 g Hb. Distribution of Hb on the surface of erythrocytes Animals Number of erythrocytes in 1 mm3 (in millions) Dog .... Pig .... Rabbit .... Cattle .... Horse Sheep .... Goat ....
Human Hb content in one erythrocyte, expressed in 10-12 g 6.59 7.44 5.86 5.72 6.94 10.70 13.94 5.00 24 22 20 19 18 11 8 30 Diameter Surface (in μ) (in cm3) 7.26 82.7 6.60 68.4 6.60 68.4 5.94 55.4 5.94 55.4 4.62 33.6 4.00 25.1 7.92 98.4 On the other hand, errors also arose from the fact that it was not taken into account that the fluids used for observations were not equally applicable to all erythrocytes; for example, Hayem's fluid, widely used in the study of human B., is not applicable for the study of goat and cattle B., as it causes agglutination and wrinkling of their erythrocytes, which cannot but affect the accuracy of the research (Behrens; 1923). In general, the size of erythrocytes is always inversely proportional to their number; however, there are exceptions to this rule. Thus, in the llama, erythrocytes are larger than in humans; but their number reaches 13 million in her under normal conditions, compared to 5 million in humans; however, at the same time, the thickness of erythrocytes in the llama is significantly less than in humans, and therefore the total volume of her erythrocytes is correspondingly lower, approaching the human norm. - Among all vertebrates, mammals have the most numerous and at the same time the smallest erythrocytes. Hb content per 1 cm3, expressed in 10-14 g 29 32 29 34 33 33 32 31/ Animals Mammals Monkey . . Human . . . Dog .... Cat .... Black mouse » white. Rat . . . Rabbit . . . Guinea pig Horse . . . Bull..... Goat .... Pig.... . Elephant .... Sheep .... Number of erythro-cytes (in millions); Diameters in μ Birds Pigeon. Crow . Chicken Duck . . Ostrich Chaffinch Reptiles Turtle . . . Lizard . . . Amphibians Frog . . . Triton.... Proteus.... Fish Usach (bony) Eel « . Skate (cross-mouthed) . . 6,000 5,000 4,420-7,225 7,300-9,900 8,700 8-9,725 9,300 4,840-6,410 3,600-5,859 6,300-7,400 5,070-6,275 9,720 5,440-6,960 2,020 11,800 2,010-4,000 2,420 2,400-3,100 2,800-3,020 1,620-1,600 3,660 0,629 1,650 0,393-0,467 0.103-0.165 0.036 1,283 1,100 0,140-0,230125X14 5.5-7.5 7.92 3.8-8 4.5-7.1 5.2-8.1 4.5-7.15 5.3-7.9 5.4-9.24 4.9-6.6 4.6-7.2 5.4 5.20-6 9.4 4.3 13.7X6.8 11.8X7.2 13.5X6.5 12.8X6.6 18.9 12.4X7.5 21.2X12.4 16.6X9.2 21.7X15 29.3X19.5 58.2X33.7 14.6X4, 15X12 Number of leukocytes Hb in % 800 6.000 10.000 7,200-15150 4,140 7,320 15,200 8,200-8,150 7,240-15000 9,500 7,840 8,500 10-31,000 26-60,000 9,000 13,200 1,750 The given figures are averages. Thus, among mammals, the elephant, having the largest erythrocytes, has the smallest number of them; among birds, the ostrich occupies a similar position; among reptiles and amphibians-proteus. Among fish, cartilaginous fish have the smallest number of erythrocytes compared to bony fish.-The comparative volume of erythrocytes and their relative Hb content are evident from the following table. Animals Volume of erythrocytes in μ3 Hb content in 1 μ3 Human .......... 0.416 μg 0.416 » 0.348 » 0.343 » 0.115 » Pigeon .......... Frog......... Proteus......... Dependence of erythrocyte count on age. The number of erythrocytes increases with age, except in cattle, in which the number of erythrocytes in early life is higher than in adult animals. Thus, in a guinea pig weighing 490 g and 23 cm long, the number of erythrocytes is 5.3 million; in an embryo weighing 3.5 g and 3.2 cm long - 1.9 million. An embryo weighing 25.6 g and 11 cm long has 3.52 million erythrocytes, and a newborn guinea pig (72 g, 12 cm) - 4.9 million erythrocytes (Bethe; 1891). In an adult bull, the number of erythrocytes is 6,503 million, and the ratio of leukocytes to erythrocytes is 1 : 729; in a calf, the corresponding figures are 8,523 and 1 : 548. Dependence of erythrocyte count on sex. In men, the number of erythrocytes is higher than in women (5.5 : 5.0). In sexually mature males, their number, as well as Hb content, is higher than in females. In castrated animals, these numbers are lower than in normal ones (see table below). Very strong fluctuations in erythrocyte count are observed in amphibians depending on the sexual cycle, and accordingly depending on the spawning period. But it is quite natural that at the same time the influence of the environment (temperature, humidity, nutrition) is also manifested. The dependence of erythrocyte count on environmental conditions is especially noticeable in aquatic animals; thus, when keeping amphibians on land, their B. gradually thickens and the relative number of erythrocytes increases accordingly; in a frog that has lost 13.1% of its original weight, there are 1,284,000 erythrocytes in 1 mm3; after losing 34.8% of its weight, their number is already 2,588,000 (Du-rig; 1901).-The size of erythrocytes varies greatly depending on the species. Structure of erythrocytes. Mammals have round erythrocytes, with the exception of tylopods, whose erythrocytes have an elliptical shape. Birds, reptiles, amphibians, and fish also have elliptical erythrocytes. In lampreys, erythrocytes are round. The questions of the existence of a shell and stroma in erythrocytes are extremely important for their structure. The question of the shell is apparently resolved in the sense that at the boundary with the environment, i.e., the plasma, the outer layer of erythrocytes has the character of a two-phase colloidal system (Berczeller; 1922). But in addition to this, a preformed stroma undoubtedly exists in erythrocytes, determining their specific shape. In close connection with the stroma are apparently the so-called marginal rings, best expressed in the erythrocytes of many amphibians and fish (Meves; 1901). These rings have a fibrillar structure and undoubtedly determine the characteristic shape of elliptical erythrocytes, including those of the llama (Jolly; 1920). Some authors also describe them in humans Animals Sexually mature animals Castrated animals Males Females Males Females Number of erythrocytes (in millions) Percentage of Hb by Sal Number Percentage of erythro-cytes (in millions) Sal Number of erythrocytes (in millions) Percentage of Hb by Sal Number of erythrocytes (in millions) Percentage of Hb by Sal Sheep...... Pig ..... 8.10 13.06 80 56 6.89 9.78 9.97 52 65 6.91 9.42 9.4 68 58 62 8.30 B. M. O. t. XIV. (Romieu; 1922). In any case, it seems very probable that the so-called Cabot rings are also similar in origin to the indicated fibrillar formations. Nucleus. In mature erythrocytes, nuclei are contained as a rule only in birds, reptiles, amphibians, and fish; but individual specimens without nuclei are also encountered in them, which is probably associated with phenomena of degeneration, karyolysis, etc. But although in the indicated forms the presence of a nucleus is inherent in both adult and embryonic erythrocytes, the latter still differ (especially in amphibians) by their larger size. In ontogenetic development, the erythrocytes of all vertebrates first pass through the stage of erythroblast-a cell with a large nucleus and narrow protoplasm. The next ontogenetic stage, characterized by a relatively smaller nucleus, is the normal form of erythrocytes for fish and amphibians; further relative reduction of the nucleus leads to the type typical for reptiles and birds, and finally the disappearance of the nucleus gives the erythrocyte of mammals. Thus, in lower classes of vertebrates, the phylogenetic type of erythrocytes is determined by the cessation of its development at an earlier ontogenetic stage (Minot; 1903). Blood plates. In mammals, blood plates have the character of peculiar small elements containing azurophilic granules in their protoplasm. In all lower vertebrates, starting from birds, plates or thrombocytes are represented by spindle-shaped cells resembling an erythrocyte in structure. They have a large elliptical nucleus, mostly with a longitudinal fold on the shell. They do not contain hemoglobin protoplasm. In serological and immunological respects, thrombocytes of lower vertebrates fully correspond to the plates of mammals. The size of spindle-shaped cells is approximately 1/2-1/3 of the corresponding erythrocytes. Apparently, these cells are also characterized by phagocytic functions. g. Epstein. V. Total mass of B. Mass of B. The widespread view that the total amount of B. in humans is approximately 1/13 of their weight is based on data obtained by Welcker and Bischoff in 1856 in two decapitated people by means of very imperfect methods. Subsequently, many methods were devised for determining the mass of B. in vivo; at present, two methods are mainly used for this purpose: inhalation of CO (inhalation method) and the introduction of colloidal dyes (dye method). - The inhalation method was proposed as early as 1882 by Grehant and Quinquaud, but came into use only after it was improved and simplified by Haldane and Smith, Plesch and Whipple. The person or animal under study is made to inhale a certain (harmless) amount of CO, and after a few minutes the CO content in a sample of B. taken from a vein is determined by the Van Slyke and Salvesen method; in another sample of the same B., the ratio of the volume of erythrocytes to plasma is determined using a hematocrit (see), on the basis of which the mass of erythrocytes (CO is absorbed only by them) and the total mass of B. are then calculated.
Example: 50 cm3 of CO inhaled; in 10 cm3 of B. found 0.2 cm3 of CO; volume of erythrocytes in hematocrit equals 45%. Mass of erythrocytes equals: 50×10×0.45 = 1,125 cm3; mass of blood equals: 1.125 : 0.45 = 2,500 cm3. - The dye method was proposed in 1906 by Kottmann, but the dyes he used (indigo, methylene blue) were not suitable for this purpose; only after Keith, Rowntree, and Geraghty in 1915, and subsequently other authors, showed the harmlessness and suitability of acid colloidal dyes (Vitalrot, Trypanrot, Trypanblau, Kongorot), this method came into widespread use. Its principle is that a certain amount of dye solution is introduced into the vein of the subject, and after 4 minutes (the time required for uniform distribution of the dye in B.), a certain amount of B. is taken from a vein of the other hand and the dyed plasma is compared in a colorimeter with a standard of a certain concentration. Since the dye is not adsorbed by erythrocytes, the amount of plasma in the body can be calculated from the degree of its concentration in the plasma, and the total mass of B. is then calculated on the basis of hematocrit data. There are numerous variations of this method. The colloidal dye infusion method gives less accurate data in nephroses and especially in amyloidosis (due to greater permeability of dyes through vessels and, mainly, due to selective adsorption of Congo red by amyloid substance) (Benhold, Griesbach); however, in the first minutes after administration of the dye, when the plasma is colorimetrically measured, these interfering factors have not yet had time to manifest themselves sufficiently. Also in splenomegalies, excessively large amounts of B. were obtained by the dye method, and this was explained by the absorption of the dye by the phagocytic apparatus of the spleen (Greppi, Hartwich, May); however, Vol'sky and Sheveleva in malarial splenomegalies did not find such an increase in the mass of B. Rather, in splenomegalies, one can expect greater lability of circulating B. due to an increase in the splenic reservoir (see below). Depending on the basic research method used and its various modifications, the 'normal' average figures for the mass of B. obtained by various researchers differ sharply from each other and range between 48 and 92 cm3 per 1 kg of weight, not to mention the extreme figures (33 cm3 and 104 cm3 per 1 kg). Particularly low average figures were obtained by the inhalation method (Haldane and Smith - 48 cm3, Plesch - 53 cm3); this is explained by the fact that with this method only those erythrocytes that are at the moment circulating in B. are detected, and CO does not reach those that are in the spleen and other erythrocyte depots; when Haldane and Douglas extended the time interval between inhaling CO and obtaining B. (mixing time) and CO, thanks to this, managed to penetrate the erythrocyte reservoirs as well, the figures for the mass of B. turned out to be much larger - 78 cm3 per 1 kg. - Among the researchers who worked with the dye method, Griesbach, Greppi, Gordon found average figures for B. between 66 and 75 cm3 per 1 kg of weight; most, however, including Keith, Rowntree, and Geraghty, Brown and Rowntree, Seyderhelm and Lampe, found from 83 to 92 cm3 per 1 kg; according to Chernyak's data, the average norm = 83 cm3, including plasma 44 cm3 and erythrocytes 39 cm3 per 1 kg. - Since the average figures differ even among authors using the same methodology, one must assume that here (as well as in relation to individual differences found by each researcher) constitutional and social peculiarities play a role, leading to differences in the degree of nutrition, development of muscles and adipose tissue. All these questions still await their resolution. - Partly this difference in normal average values of the mass of B. among various authors is explained by the fact that until recently no precise distinction was made between the mass of circulating B., which is in a state of rapid movement in the bloodstream, and the mass of blood in the blood reservoirs or depots, where the blood, as it were, stagnates, being excluded from active circulation by special mechanisms (primarily in the spleen by contraction of the muscular elements of Schweiger-Seidel capillaries, in the liver due to contraction of the lock apparatus of the hepatic veins of Arey and Symonds, in the subcutaneous subpapillary plexus, etc.). Experiments by J. Barcroft and his school showed that a decrease in the size of the spleen (with an increase in ambient temperature, a drop in atmospheric pressure, with physical exertion, with affects of anger, digestion, pregnancy, and some other conditions) is accompanied by the entry of this reservoir blood into the general circulation and thereby can increase the total mass of B., as well as change the ratio between plasma and cellular mass, because the blood of the splenic depot, ejected when its muscular trabeculae contract into the general circulation (sang de chasse of Binet), is much richer in erythrocytes, leukocytes, and platelets than circulating B. (partly due to their sedimentation by gravity during B. stasis). However, this separate accounting of the mass of circulating and reservoir B. has hardly been used in clinical practice except in the question of various types of cardiovascular decompensation (see Circulation). In clinical practice, determination of the mass of B. has found fairly wide application in studying various anemic conditions and diseases in which so-called 'thickening of the blood' and 'plethora' were assumed. These vague terms and especially the latter with its subdivisions contributed to the emergence of a number of incorrect pathogenetic concepts. Research on the mass of B. made it possible to replace them with quite rational concepts proposed by Brown and Rowntree and deserving the widest dissemination. In the presence of a normal mass of B., they speak of normovolaemia, with an increase in the mass of B. - of hypervolaemia, with its decrease - of hypovolaemia. Depending on the ratio between the mass of erythrocytes and plasma (according to hematocrit), they then divide each of these categories into simple (normal ratio), polycythemic (relative increase in the mass of erythrocytes) and oligocythaemic (relative decrease in this mass). Thus, 9 categories are obtained, into which all changes in the mass of B. fit, which give a clear idea of these changes. I simplex, polycythaemica, oligocythaemica. Mass of B. in anemias. After acute hemorrhages in humans and experimental bloodlettings in dogs, Smith, Plesch, Whipple, and others found that the loss of B. is very quickly replaced by a corresponding increase in the mass of plasma, as a result of which the mass of B. can even exceed the original, especially with rapid onset of erythrocyte regeneration. In chronic hemorrhages, however, a noticeable decrease in the mass of B. can occur (Plesch, Griesbach, Mendershausen, Chernyak), but almost exclusively at the expense of the mass of erythrocytes (hypovolaemia oligocythaemica), while the mass of plasma remains almost unchanged or even increases. In so-called secondary anemias of various origins, Keith, Rowntree, and Geraghty, Griesbach found the mass of B. to be normal; Gordon, Hartwich, and May found an increase in the relative mass of B. (evidently in connection with the emaciation of patients), but some decrease in the absolute; similar data - in Cipriani and Giorgio; in Chernyak's cases both absolute and relative mass of B. turned out to be within the norm (on average - 82.6 cm3 per 1 kg). However, the ratio between erythrocytes and plasma is sharply disturbed: the mass of the former is sharply reduced (23.7 cm3 instead of 39), the mass of the latter is increased (58.9 cm3 instead of 44). Thus, for 'secondary anemias' the type normovolaemia oligocythaemica can be considered characteristic. - In pernicious anemia, the mass of B. fluctuates depending on the stage of the disease: during remission it is normal, during relapses it decreases, and the mass of plasma increases, but cannot compensate for the loss of erythrocytes; in the preterminal period ('coma') Mendershausen found a new increase in the mass of B. due to dilution (Verwasserung) of the plasma. According to Rusznyak's data, the mass of B. in pernicious anemia is normal, and during remission it is increased. - In leukemia, determination of the mass of B. is complicated by splenomegaly (see above); Keith, Greppi obtained very large figures; however, Mendershausen found in three cases oligocythaemic hypovolaemia or normovolaemia. Similar data were obtained by Jun in three cases of lymphogranulomatosis. - In chlorosis, the data of authors differ: Smith and Plesch found significant hypervolaemia, Griesbach - both hyper- and hypovolaemia, Hartwich and May - hypovolaemia with normal plasma mass. Mass of B. in polyglobulias. Of great interest are the data obtained regarding true polycythemias of Vaquez and Gaisbock. In all such cases, a significant increase in the total mass of B. was found, reaching in one case of Brown and Griffin 224 cm3 per 1 kg.
Zeydergel'm and Lame drew attention to the fact that in polycythemia rubra Vaquez there is always an increase in the relative mass of erythrocytes, sometimes reaching 80% of the mass of Blood (polycythemic hypervolemia), whereas in the polycythemia of Geisbeck the ratio between the mass of erythrocytes and plasma remains b. or m. normal (simple hypervolemia or, according to Zeydergel'm and Lame, polycythemia).-Among the symptomatic polyglobulias, the polyglobulia observed in tbc of the lungs should be noted. The contradiction between the external pallor of these patients and the composition of their Blood was explained at one time by Grawitz as a result of 'thickening of the Blood,' masking the actual anemia. However, studies of the mass of Blood conducted by Brieger in 23 tuberculous patients showed that neither the total mass of Blood nor the mass of plasma is reduced in them, and with significant emaciation they may even be relatively increased. Similar data can be found in Mendershausen's work. Chernyak's studies gave an average mass of Blood in tuberculous patients of 86 cm3 per 1 kg, and of plasma-48 cm3. Grawitz's hypothesis should therefore be rejected, and the polyglobulia of tuberculous patients should be considered quite real.-In congenital heart defects accompanied by polyglobulia, Plesch and Grisbach found a sharp increase in the mass of Blood due to erythrocytes with a normal or even slightly reduced amount of plasma (polycythemic hypervolemia).Changes in the mass of circulating Blood in conditions of collapse and cardiac decompensation, see Blood circulation, pathology. Regarding kidney diseases, the opinion has long been established that the accompanying anemia, edema, and hypertension are due to hydremia (see) or 'hydremic plethora' (see Plethora). Numerous studies of the mass of blood show, however, that an increase in it is observed in only about half of nephrotics, while in the other half and in nephritics there is normo- or hypovolemia, and in anemics- oligocythemic hypovolemia. The anemia of Bright's disease is thus a true anemia (Zeydergel'm and Lame, Brown and Roundtree) of the hyporegenerative type (Tareev). The formation of edema and their decrease are also accompanied in kidney patients by significant fluctuations in the mass of Blood; however, no constant relationship is observed between 'edema of the blood' and tissue edema (Brown and Roundtree, Tareev). There is also no definite dependence between the mass of Blood and nephritic hypertension (Tareev).-As for other types of hypertension, there are observations of a parallelism between fluctuations in blood pressure and the mass of Blood (Grisbach, Plesch); however, all authors agree that the height of pressure is not determined by the mass of Blood. Among other pathological conditions, a decrease in the relative mass of Blood and plasma can be noted in obesity. After weight loss, both an increase and a decrease in the mass of Blood are observed (Brown and Key). In this connection, mention should be made of the observations of Thompson and Chernyak, who saw an increase in the mass of Blood in myxedematous patients under the influence of thyroidin. On the contrary, under the influence of insulin, the mass of Blood according to Villa's data noticeably decreases. Changes in the mass of Blood are observed under the influence of pilocarpine, atropine, morphine, ether anesthesia (Grisbach).-Among physiological conditions affecting the mass of Blood, pregnancy should be noted, in which most authors find hypervolemia, while Neubauer found a normal mass of Blood.-In newborns, relative hypervolemia is found when calculated per 1 kg of weight and a decrease in the mass of Blood when calculated per surface area of the body (Zeydergel'm and Lame).
I. Chernyak. VI. Relationship between the formed elements and Blood plasma. Blood is a suspension of formed elements (erythrocytes, leukocytes, and platelets) in liquid plasma. Left to itself, blood outside the organism clots completely; the ratio of serum, which separates later due to retraction of the blood clot, to this clot does not repeat the original ratio of the liquid part and formed elements of blood due to the precipitation of fibrin and the different density of the blood clot. One cannot form a correct idea of the richness of blood in plasma if the blood is defibrinated and allowed to sediment on its own. To avoid defibrination and better preserve erythrocytes, Markano (Magsapo) diluted blood with a formalin solution of Na2SO4 with the addition of NaCl, left the blood standing in a small graduated conical vessel, and calculated the percentage content of formed elements in blood from the size of the sediment. Biernacki instead of diluting blood added minimal amounts of oxalate (2 mg per 1.0), and Gravitius constructed a special apparatus on the same principle—Blutvolumimeter. However, during independent sedimentation, intercellular spaces filled with plasma remain between the blood cells, so more accurate results are obtained by mechanical centrifugation. Such an apparatus, the hematocrit (see.), modeled after lactocrits of the dairy industry, was constructed by Hedin and widely applied by Daland. The hematocrit consists of a pair of graduated capillary tubes fixed in a special metal stand with an attachment for centrifugation. Hedin added to blood oxalate 1:1,000 and diluted blood before centrifuging with an equal volume of 0.9% NaCl solution. It is very difficult to obtain really accurate data with a hematocrit, since oxalate and citrate in substance cause significant changes in the volume of erythrocytes, as well as hemolysis; and isotonic solutions of them are often not isotonic for pathological blood. Grisbach pre-defibrinates blood (the loss of erythrocytes in this is so small that it is not revealed by comparative counting). It is better to add to blood hirudin (or heparin). Kepppe and Kappe (Koeppre, Capps), with rapid manipulation using a powerful centrifuge at 5,000 revolutions per minute, manage without any anticoagulant or are satisfied with paraffining the capillaries; the separation of blood into layers occurs so quickly that clotting is prevented, and at the same time so completely that all intercellular fluid is removed; this changes the usual conditions of light refraction, and the column of erythrocytes appears transparent, varnished (in the absence of hemolysis). In the absence of such a centrifuge, it is preferable to work with a large amount of blood in exactly calibrated centrifuge tubes of 15 cm3, which gives greater accuracy of results. The percentage content of plasma in blood can also be determined indirectly by the content of any substance in whole blood and in plasma (the rule of mixtures). Thus, Bunge for this purpose used the fact that in fresh-water species Na is found exclusively in plasma and is absent in erythrocytes. Hoppe-Seyler for the same purpose determines the content of fibrin in whole blood and in plasma. One can also determine the distribution of an added indifferent substance that does not penetrate into erythrocytes or certain physicochemical properties of blood and plasma that are sharply different for formed elements and the liquid part (e.g. electrical conductivity—Hober), specific gravity (Gravitius), viscosity, and especially refractometry (Alder). As a result of all the methods given, it has been found that formed elements in normal conditions constitute somewhat less than half of the entire blood, on average 44%. Froehlich gives figures of 45.13% for men and 41.38% for women. The figures of other authors often fluctuate within much wider limits. Venous blood contains a large volume of erythrocytes due to their swelling from CO2. Muscular work causes an increase in the total volume of erythrocytes due to an increase in their number, caused by contraction of the spleen (Barcroft). In various mammals, large fluctuations in the normal volume of erythrocytes are described [27.8 in goats and 39.4 in pigs (Goetze)]. In human pathology, depending on anemias or erythrocytemias, fluctuations range from 9% to 80%. Determination of the volume of erythrocytes is important for studying fluctuations in the size of individual red corpuscles and their saturation with Hb. The so-called volume index of Capps (Volume index), expressing the ratio of the percentage change in the mass of erythrocytes to the percentage change in their number in a given blood, is a constant value in normal conditions and gives characteristic deviations in various forms of anemias: decrease in secondary and increase in pernicious anemia; in the latter, this increase in the volume index is an earlier sign than the increase in the color index (Haden). The saturation index, on the contrary, remains below normal even in pernicious anemia, i.e., the increase in the color index occurs only due to the size of the corpuscle. During spontaneous sedimentation or centrifugation of blood, lighter nucleated erythrocytes, reticulocytes, and erythrocytes with malarial parasites accumulate predominantly in the upper layers, which can be used to enrich smears with the corresponding elements. Above the column of erythrocytes in the hematocrit, a layer of leukocytes accumulates (about 1% in normal conditions and much more in leukemias). Platelets are located in the upper layers; by repeated centrifugation, platelets can be isolated almost in a pure state, especially from horse blood. It must be remembered that in circulating blood, significant mutual movements of water, salts, protein, etc., occur between erythrocytes and plasma under the influence of the work of organs, metabolism, etc., and accordingly, a certain percentage ratio of plasma and formed elements is not a CONSTANT value.
E.
Tareev. VII. Morphological composition of B. and methodology of its research. Morphological composition of blood. In healthy people, fasting blood reveals a fairly constant morphological composition, fluctuating within relatively narrow limits, especially for the same individual. In different people, fluctuations in the morphological composition of blood can be caused by sex, age, climatic, racial factors, as well as various other geno- and paratypic factors. Changes in the morphological composition of blood, especially upon repeated examinations in the same individual, have great diagnostic significance and are widely used in clinical practice. Usually for diagnostic purposes, the determination of the number of formed elements of blood (erythrocytes, leukocytes, and thrombocytes) by their counting (see Counting chambers) is used, as well as the study of their qualitative composition (see Leukocyte formula, Hemogram, Erythrocytes, Bizzozero plates) and the determination of the amount of Hb. The number of red blood corpuscles in an adult male usually fluctuates in normal conditions between 4.5-5 million in 1 mm3, in a woman—between 4-4.5 million in 1 mm3. The number of thrombocytes fluctuates in normal conditions from 130 to 750 thousand (usually 250-300 thousand). The number of white blood corpuscles fluctuates within 6-8 thousand. Any shifts and deviations from the given quantities are considered pathological. The qualitative composition of blood is studied in dry preparations, resp. in a thick drop, after preliminary staining of them (see below—Methodology of research). In this way, the so-called leukocyte formula is calculated, the nature, size, saturation with pigment, peculiarities of form, pathological inclusions in erythrocytes, granularity, structure of the leukocyte nucleus are determined, as well as the number and peculiarities of the structure of thrombocytes. The amount of Hb is determined with the help of hemometers (see). For more details, as well as about all deviations from the norm of various blood elements, see Anemia, Anisocytosis, Infant, Hemogram, Hemoglobin, Leukemia, Leukocytes, Leukocytosis, Leukopenia, Blood leukocyte formula, Erythrocytes and the corresponding articles about individual diseases. Methodology of research. Morphological research of B. establishes the quantitative and qualitative composition of its formed elements. This research is either purely scientific in nature or pursues a practical purpose as an auxiliary method for establishing the diagnosis of a disease and its course. For such research, a small amount of blood is required, which in humans is easily obtained by pricking the tip of a finger or the earlobe. The skin is previously cleansed and degreased—washed with warm water and soap, then with ether and alcohol. Naegeli recommends when taking blood from a finger to warm the hand in

Fig. "1."
in hot water to obtain active hyperemia and so that it is not necessary to squeeze the Blood. It is best to take blood in the morning on an empty stomach. The puncture is usually made with a Frank needle (Fig. 1) or else with a steel pen, from which half of the point needs to be broken off. The first drop is wiped away, and then a fresh one is taken each time. In animals (rabbit, guinea pig, etc.) Blood is taken by puncturing the ear vein with a syringe needle; in mice and rats the tip of the tail is cut off; in fish a fin is cut; in birds Blood is obtained by puncturing the comb or from the wing vein. First the blood is drawn into a pipette for determining the amount of Hb (see 'Hemometers'), and then into mixers for red and white blood cells for counting them in chambers (counting erythrocytes-see Counting chambers). For dilution, either a 3% solution of NaCl or Gower's fluid (see Gower's solution) is used. It is necessary to ensure that there are no air bubbles and that clots of Blood do not form. By gentle shaking for 2-3 minutes, an even distribution of the elements of the suspension in the mixer ampule is achieved, in which a glass bead is placed for this purpose.-To fill the chamber, a small drop of suspension is placed in the middle of it and then quickly covered with a cover glass; the latter is first placed on one edge at an acute angle, then quickly lowered; the first drops from the mixer are first released onto filter paper. The chamber should be filled with suspension, there should be no air bubbles, the liquid should not go beyond the groove surrounding the chamber. On both sides of the groove on the outside, the surface is slightly moistened so that the cover glass adheres better and Newton's rings are formed. The counting technique-see Counting chambers.-For humans the average norm is 4,500,000-5,000,000 erythrocytes in 1 mm3. Counting leukocytes. In the Tom mixer, behind the ampule of which there is a mark 11 (dilution 10 times), Blood is drawn up to the mark 1.0 (with leukocytosis up to 0.5). In leukemias with high leukocyte counts, the erythrocyte mixer is used. The liquid for dilution is diluted acetic acid with an admixture of dye for revealing leukocyte nuclei: Acid. acet. glac.-3.0, Gentiana violet (1% aqueous solution)-3.0, Aq. dest.-300.0. The counting technique-see Counting chambers. The average norm for the number of white blood cells for humans is 6,000-8,000 in 1 mm3.-For counting blood platelets by Bizzozero's generally accepted Fonio method, the tip of the finger is first applied with a drop of 14% Magnesium sulfate, a puncture is made through it, then the emerging drop of blood is mixed with a drop of solution and a smear is made on a slide (the drop of Magn. sulfur solution can also be applied after the puncture). The smear is best stained by Giemsa's method, then an eyepiece proposed by Schilling is inserted for the convenience of counting platelets and erythrocytes. Having counted how many blood platelets are per thousand erythrocytes, their content in 1 mm3 of Blood can be calculated, first determining the number of erythrocytes in 1 mm3. Besides Fonio's method, there are many other methods.-Determination of the color index (Farbeindex). From the obtained percentage amount of Hb and the number of erythrocytes in 1 mm3, the so-called color index is calculated, i.e., the index of Hb content in each erythrocyte. This calculation is based on the premise that in normal conditions there is maximum saturation of the erythrocyte with hemoglobin. The norm corresponds to 100% Hb with 5,000,000 erythrocytes in 1 mm3. The color index is calculated by the formula: p-г found, amount of Hb found, amount of erythrocytes __ 1 -
юо
'
бТооо.ooo
" ~ _ found, quantity of cells 5,000,000 - 100 found, quantity of erythrocytes. Normal color index = 1; with hyperchromia the color index is above unity, with hypochromia below (see Hyperchromasia). Further research of blood cells is conducted in three directions. I. Research in fresh state. A drop of B. is placed on a slide and covered with a cover slip (slides must always be well washed and degreased). The preparation is sealed at the edges with paraffin. B. of warm-blooded animals is examined under the microscope for a long time on a heating stage - an electric stage with easily adjustable temperature is most convenient. Erythrocytes stack into characteristic coin columns; free erythrocyites in some places reveal a biscuit-like, biconcave shape, some of them have a bell-like appearance. Here it is also determined whether there is poikilocytosis (see) or apocytosis (see) of erythrocytes. In pathological cases vacuoles may be found in erythrocytes. Among granulocytes eosinophiles stand out particularly sharply due to their brilliant large granularity. After some time fibrin threads with accumulations of blood platelets appear. Granulocytes and mononuclears reveal amoeboid movement; lymphocytes move extremely slowly. In malaria pigment is sometimes found in mononuclears and neutrophiles. This same preparation when examined in dark field (Dunkelfeld) reveals more sharply the granularity of neutrophiles, moving according to the existing protoplasmic currents in the cell; when the cell dies the granularity begins to exhibit Brownian movement. In mononuclears granularity is also revealed (Naegeli). Hemokonies - lipid particles - are also well visible in dark field. Parasites of B. - spirochetes and trypanosomes - are also excellently visible in dark field. II. Research of formed elements in stained state. A B. cell, like any other cell of the organism, is subject to certain laws in relation to staining substances, conditioned by the properties of its membrane and structure. Since the permeability of cell membranes and the stainability of cell structures differ in living and dead cells, staining of blood cells can be vital and postmortem; as an intermediate link here is the so-called pre-vital or post-vital staining of dying cells. - 1. Vital staining is divided according to the law of permeability of the living membrane into two groups: 1) staining with basic and 2) with acid dyes.-1) Vital staining with basic dyes. Of basic dyes in hematological technique, Neutralrot and Janusgrun are mainly used for vital staining. However, many authors consider this staining atonal as well. Basic dyes, being soluble in lipid mixtures that make up the cell membrane, easily penetrate into the cell, staining here preformed structures, mainly adsorbing on their surfaces. Like many other organic coloring substances, Neutralrot is an indicator of reaction; it changes its color depending on the reaction of the medium in which it is located. The change in color of structures stained with Neutralrot up to their complete decolorization is thus a very fine reagent for revealing the variability of protoplasm. Penetrating into the protoplasm of the cell, Neutralrot stains special formations - granules; Janusgrun is considered a specific dye for mitochondria.-Staining of B. with Neutralrot and Janusgrun by Sabin's method. For this staining two solutions are prepared: 1) Neutralrot 0.1 g in 10 cm3 of absolute alcohol and 2) Janusgrun - alcoholic solution of the same concentration. On the day of research (or the day before) 5 cm3 of absolute alcohol is added to 20 drops of the first solution and 15 drops of the second, it is shaken and applied to a thoroughly washed slide so that the dye flows freely from the slide placed vertically on filter paper. After the slide covered with dye is completely dry, a drop of the blood under examination is placed on it, covered with a cover slip and put in a moist chamber for x/g hours. The staining is considered complete when in the protoplasm of lymphocytes and mononuclears orange Neutralrot granules and mitochondrial granularity (stained green with Janusgrun) are revealed; Neutralrot granules are also present in neutrophiles. The nuclei of leukocytes remain completely colorless. Sabin considers the rosette-like arrangement of Neutralrot granules corresponding to the centrosphere as characteristic for normal mononuclears. However deviations are also often encountered. The rosette-like arrangement of Neutralrot granules is also present in myeloblasts. Janusgrun mitochondria and Neutralrot granules are also found in erythroblasts. Both Janusgrun mitochondria and Neutralrot granules are preserved for some time in young erythrocytes. In normal they are found in small numbers (1-5 in the preparation), with enhanced regeneration their number increases to many in each field of view. When erythrocytes die the granules and mitochondria begin to exhibit Brownian movement and then disappear, after which after some time the granulo-filamentous substance (see below) begins to be stained with Neutralrot. On this basis Freyfeld considers the Neutralrot-Janusgrun staining vital, while other authors consider it pre-vital. 2) Vital staining with acid dyes. The method of penetration of acid dyes, insoluble in lipids, into the cell is completely different from that of basic dyes: these substances enter the cell due to the physiological variability of its membrane (physiological permeability according to Hober); in other words, they enter the cell by phagocytosis. Therefore the greater the phagocytic ability of a given cell, the more easily it is stained with acid dyes. Vital staining with acid dyes is used by injecting them into animals. - Injection of Lithioncarmine according to Ribbert. If possible a concentrated solution of the dye is taken and carefully filtered. 5-10 cm3 or more is injected into the vein depending on the size of the animal. The peripheral B. and organs of the animal are examined.-Indigocarmine according to Heidenhain is injected intravenously into animals as a 0.4% aqueous solution, quantitatively depending on the weight of the animal; thus rabbits receive 35-60 cm5, dogs 150-1,500 cm*. After various intervals of time the animal is killed, organs are washed through arteries with absolute alcohol and fixed in absolute alcohol.-Injections of Pyrrol I or Isaminblau according to Goldman. A 1% aqueous solution is taken at 1 cm3 per 20 g of body weight (massage the injection site); injections are repeated after 6-7 days. Organs are fixed in formalin and cut on a freezing microtome. The phagocytized dye is found in some mononuclears and in the reticulo-endothelium of organs. 2. Pre-vital (supravital) staining. The most commonly used are Brillantkresylblau, Nilblau-sulfate, Methylviolett, Neutralrot, Methylene-azur. For this research it is more convenient to use not a drop of B. covered with a cover slip, but smears of B. The smear can be made on a slide or on a cover slip, as shown in Fig. 2. For smear
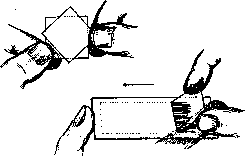
Fig. 2.
A second or third drop of B. is taken, appearing at the site of the puncture with light pressure. The convexity of the drop is quickly covered with a slide, approximately a finger's width from the edge of the long side of the slide, then the slide is held with the left hand, and a coverslip is brought close to the drop with the right hand; the drop of B. is distributed along its edge and follows it as it advances. In this way, an even smear is obtained, not reaching the edges of the slide. A smear on a coverslip is made as follows: the coverslip is quickly applied to the drop of blood; around the resulting drop on the coverslip, a film from steam forms, which quickly disappears; then the drop, when another coverslip is placed on it, is distributed between both coverslips due to capillarity, after which they are quickly separated, as shown in Fig. 2. The smears must be made carefully, as they to a large extent determine the possibility of obtaining a good preparation.- Staining with Brillantkresylblau. A saturated solution of the dye is prepared in absolute alcohol (approx. 1 part Brillantkresylblau to 80 cm3 absolute alcohol). A little of the solution is applied with a glass rod to a heated slide or coverslip and quickly spread with another slide (similar to a B. smear); a barely noticeable bluish-lilac film is obtained on the slide. Slides prepared in this way are suitable for use for a long time. A smear of B. is then made in the usual way on the stained slide, which is immediately (while wet) transferred for 3-5 minutes to a moist chamber; the latter is a Petri dish or a Dzialalski dish, in which a roll of moist filter paper is placed around the perimeter (there should be no water in the bottom of the chamber). In the chamber, Brillantkresylblau stains the granular-reticular substance of the erythrocytes; then the preparation is removed from the chamber and allowed to dry in the air, after which it is examined under immersion (see separate table, Fig. 2). On average, B. of a healthy person contains from 1‰ to 8‰ reticulocytes, i.e., young erythrocytes with substantia granulo-filamentosa.-Regarding the origin of the granulo-filamentous substance, the opinions of authors differ. Thus, Schilling considers it a derivative of the basophilic stroma of polychromatophilic erythrocytes, while Sabine and other authors believe that the granulo-filamentous substance originates from the mitochondrial apparatus. Schilling combines the staining with Brillantkresylblau with staining according to Giemsa in such a way that the stained vital smear is fixed for 3 minutes with methyl alcohol, and then stained with the usual Giemsa mixture. The preparations turn out very beautiful; however, part of the vital granulation often disappears; therefore, such preparations are less suitable for counting.-The technique of staining with Nilblausulfat is completely analogous. Schilling recommends it for revealing erythroconts in erythrocytes in pernicious anemia and in hemolytic anemias. Staining of Heinz bodies with methyl violet. When poisoned by blood poisons (aniline, nitrobenzene, Berthollet's salt, arsenic hydride, etc.), leading to the formation of methemoglobin in the blood, one or more so-called Heinz bodies appear in the erythrocytes, which are not always well stained by the above-described method of Brillantkresylblau and stand out very well when stained with methyl violet (1 g of methyl violet is dissolved in 100 cm3 of 0.6% aqueous NaCl solution). A drop of the said solution is added to a drop of B. on a slide, covered with a coverslip, and kept in a moist chamber. Heinz bodies appear as dark purple-colored grains (see separate table, Figs. 4 and 5). 3. Staining of fixed blood smears. This method of blood examination has the greatest application in hematology. Staining of the preparation requires its preliminary fixation, for which various fixing liquids (or vapors) as well as high temperature are used. The speed and quality of fixation to a large extent determine the effect of subsequent staining. Solutions of some dyes simultaneously fix and stain the preparation. P. Ehrlich, when staining white blood cells with Triacid, believed that with the help of dyes a chemical analysis of the cell could be carried out in the sense that its alkaline components would be stained with acid dyes, and its acid components with alkaline dyes. Accordingly, leukocytes, depending on the stainability of their granulation, were subdivided into neutrophils, eosinophils, and basophils. However, the incorrectness of the basic principles of this theory was soon proven by Ehrlich's pupil Michaelis, who showed all the complexity of the processes occurring during staining and established that here the role of chemical processes is usually small, and physicochemical processes come to the forefront (see Histological technique). Staining of the fuchsinophilic granulation of lymphocytes according to Schridde and of mitochondria according to the Schridde-Altman method. 1) A thin fresh smear of B. on a slide is immediately fixed in Formol-Muller (1:9) for 1-2 hours. 2) Rinse for several minutes in running, then in distilled water. 3) 1/2 hour in 1% solution of osmic acid (in the dark). 4) Quickly rinse in water. 5) Staining in the following solution: 100 cm3 of a saturated cold filtered solution of aniline in distilled water + 20 g of acid fuchsin. Filter. The dye is poured in a thick layer onto the slide, heated 5-6 times over a flame, each time until small vapors appear, then completely cooled. 6) The dried dye is wiped from the edges of the slide with filter paper, then the preparation is differentiated in a solution of one part of saturated alcoholic solution of picric acid and seven parts of 20% alcohol until it becomes yellowish. 7) Rinse in absolute alcohol. 8) Xylol. Canadian balsam.-With this method, Schridde revealed fuchsinophilic granulation in lymphocytes, considering it specific for this type of cell, since it is not revealed in myeloblasts or erythroblasts with this staining. Freyfeld modified the Schridde-Altman staining by fixing the preparations for up to an hour in 1% osmic acid and applying mild heating of B. smears made on a coverslip over a small flame of an alcohol lamp for 15-20 minutes. The preparation is heated repeatedly, vapors should not appear. With this technique, fuchsinophilic granulation characteristic of mitochondria is found in lymphocytes, mononuclears, myeloblasts, erythroblasts, as well as in very young erythrocytes (see separate table, Fig. '3). Klein worked with a similar technique and obtained similar results.-Staining with Triacid by Ehrlich. Triacid contains in solution Methylgrim, in which three basic groups are saturated with two acid dyes: Orange G and acid fuchsin. 1) A B. smear (preferably on a coverslip) 1-2 days old is fixed by heat on a heated copper plate in a place where a drop of water applied to it does not boil, but rolls in the form of a bead (Leidenfrost phenomenon); fixation time is 10-20 sec.; the coverslip is placed smear-side down. 2) The dye is pipetted onto the preparation and left for 5-10 min. 3) Washing with water until the dye stops coming off. 4) Dry with filter paper. Canadian balsam. The granulation of neutrophils is clearly stained in a reddish-violet color, the grains of eosinophils in a bright copper-red color (see separate table, Fig. 6). In the other blood cells, granulation is not revealed. The nucleus is stained diffusely, without structure, in a bluish-greenish color, in places with the appearance of dark green grains. Staining with Eosin-Methylblau (Jenner, May and Grünwald). The preparation is stained immediately after preparation. The dye is dissolved in methyl alcohol and therefore preliminary fixation is omitted. 1) Undiluted dye is poured onto the preparation for 2-3 min. 2) As much distilled water is added as was previously poured dye. Stain for 5-15 min. 3) Thorough washing in distilled water until the preparation becomes pink. 4) Dry'. Canadian balsam. With this staining, the granulation of basophils, eosinophils, and neutrophils is beautifully revealed (see separate table, Fig. 7); other white blood cells without granulation in the protoplasm. A similar picture is given by staining according to Leishman.-Staining with Methylenblau. Various methylene blues are used, for example Methylenblau medicinale purissimum from foreign firms (Hochst, Grübler), as well as of Russian production; usually a 1/2-1% solution or the so-called Löffler's alkaline methylene blue, or Boraxmethylenblau Manson's is used. Preparates fixed with alcohol and heat are stained for up to one minute with the corresponding solution. A more delicate staining is given by prolonged staining with a very diluted methylene blue; for example, a 1% aqueous solution of Methylenblau med. pur. (5 drops in 20 cm3 of tap water) when stained for one hour completely reveals the basophilic granulation of erythrocytes, polychromasia, as well as the basophilia of the protoplasm and pathological granulation of neutrophils.
Schmidt and Schwarz (Schmidt, Schwarz) stain the basophilic granularity of erythrocytes according to Manson; Koch (Koch) with Azure II; Teleky with polychrome blue. Stains containing Methylenazur. After Romanovsky established that under the influence of alkali action on methylene blue, Methylenazur is formed, which helps obtain excellent panoptic staining of blood preparations, many methods for preparing azur-containing stains were proposed. The best combination is solutions of Azure II-eosin. This staining has become especially widespread in the form of Giemsa solution. Staining according to Giemsa. 1) Fixation in absolute methyl alcohol for 3 min. 2) Stain with a diluted Giemsa solution: 15-16 drops of the commercial solution per 10 cm³ of distilled water. 3) Wash with tap water. 4) Dry with filter paper. Very bright preparations are obtained if, according to Pappenheim (Pappenheim), the preparation is first stained according to May-Grunwald, and then with Giemsa solution (fixation with methyl alcohol is omitted, as it is contained in the May-Grunwald solution).-Staining results (see separate table, Figs. 9 and 10): nuclei of cherry-violet color Figure 1-14. Red and white blood corpuscles of blood with various stains: 1-Neutralrot-Janusgrun; 2-Brillantkresylblau; 3-modified staining according to Schridde-Altmann; 4-Methylviolett, Heinz's corpuscles; 5-Heinz's corpuscles with staining by Brillantkresylblau; 6-Triacid Ehrlich; 7-May-Griinwald; 8-Methylgrim-Pyronin Pappenheim-Unna; 9-Azur II-Eosin (Giemsa); 10-basophilic granular erythrocytes and Jolly's corpuscles (below) with azur-eosin staining; 11-carbol-fuchsin-methylene blue (normal); 12-carbol-fuchsin-methylene blue (toxicity of neutrophils); 13-oxidase reaction; 14-peroxidase reaction. er-erythrocyte, n-normoblast, m-myeloblast, n-neutrophil, e-eosinophil, b-basophil, m-mononuclear, l-lymphocyte. Figure 15. Elements of bone marrow. 20-hour culture of hemocytoblasts from the blood of a patient with acute myeloid leukemia. Hemopoiesis in vitro: H-hemocytoblasts; M-mitoses of neutrophilic myelocytes; C-segmented neutrophil; e-erythroblasts; D-degenerating cells (Zenker-formol, paraffin, section, azur-eosin). Figure 16. Plasma of normal blood. Figure 17. Serum of normal blood. Figure 18. Serum of blood in cardiac stasis. Figure 19. Serum of blood in pernicious anemia. Figure 20. Serum of blood in mechanical hemolysis. (For illustration. article Hematopoiesis, Blood.)
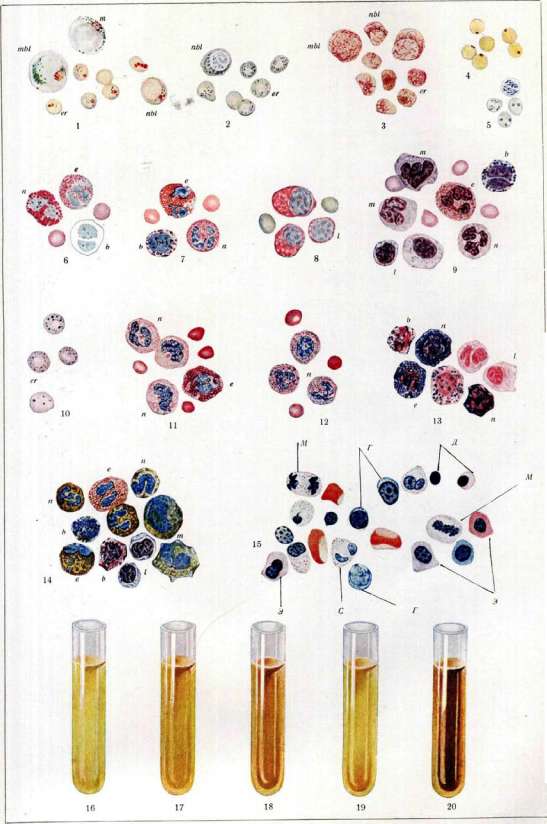
See article: Hematopoiesis, Blood.
color, pyknotic nuclei are often blue. The structure of the nucleus is well differentiated. The granularity of neutrophils is violet, the granularity of eosinophils depending on fluctuations in pH is either bright red or somewhat brownish or bluish. The azurophilic granularity of monocytes and azurophilic granules of lymphocytes (see the nature of the staining in Giemsa) are well stained, which due to eosin become bright red in color (the so-called Romanovsky effect). Chromatin of malaria plasmodia and trypanosomes is also stained in the same azure-red color. III. Research in a thick drop according to Ross (Ross). To detect a small quantity of malaria plasmodia, it is necessary to use a thick drop, in which one can easily see the parasites after hemolysis of erythrocytes. Preparation of the slide: two drops of blood are applied to a slide, which are spread with a platinum needle into a circle approximately 1 cm in diameter; then the slide is well dried (for speed, it can be placed in an incubator). The unfixed slide is poured with a solution of Giemsa stain (or the below-described solution of Azur II-Eosin) prepared in the usual way; after 3 minutes, the stain is carefully poured off by tilting the slide; at the same time, fresh stain is added, which is left for 25 minutes. Then the slide is carefully washed in a horizontal position with distilled water, dries in a vertical position (under no circumstances should it be dried with filter paper). Shilling uses a thick drop for an approximate count of polychromatophils; the latter reveal a basophilic stroma, precipitated in the form of a mesh. Eosinophils are also determined in a thick drop in cases when they are very few in blood smears. Nocht's method. One can obtain solutions of azure-eosin equivalent to the patented Giemsa stain by Nocht's method. Two solutions are prepared: 1) 1.0 g of Azur II (preferably Grubler's or Merck's) is dissolved in 1,000 cm³ of distilled water; 2) 1.0 g of eosin is dissolved in 1,000 cm³ of distilled water. Then each solution is poured separately into droppers. To establish the correct mixture for staining blood elements, several trial smears are prepared, each of which is stained with a different mixture, e.g., for 3 cm³ of distilled water, 4 drops of Azur II solution and 4 drops of eosin solution (ratio 4:4) or 4:5, 4:6, etc. The slide with cherry-red nuclei with revealed granularity of neutrophils establishes the correct mixture of stains. Determination of changes in neutrophils obtained with various intoxications, using azure-eosin staining. With various diseases (pneumonia, purulent processes, typhoid fever, tuberculosis, etc.), the granularity of neutrophils becomes larger and polymorphic, and in the protoplasm appear bluish clumps (Dohle inclusions) along with disappearance of granularity and vacuolization of protoplasm. Sharp changes in neutrophils can be seen on any slide well stained with azure-eosin; for weaker changes, one can use only stain with a certain concentration of hydrogen ions. For this purpose, Hollborn (firm Grubler) prepares Giemsa with pH=5.4; the water used for dilution should be neutral. The reaction of the water can be established with hematoxylin: to 10 cm³ of distilled water add (with clean tweezers) a few crystals of hematoxylin; no earlier than 1 minute and no later than 5 minutes, the water should slightly turn purple. If after 5 minutes the water does not acquire this color, one can add dropwise a 1% solution of sodium carbonate until the correct color reaction appears and thus correct the water reaction. Titrated Giemsa solution is used by Negeli, Gloor, and others, while Mommsen proposed establishing pathological granularity with a buffer solution at pH=5.4. With such staining, only pathological granularity is revealed, while normal granularity is not stained. Buffer solution: 21.6 cm³ of caustic soda (Merck), 27.0 cm³ of glacial acetic acid (Merck), distilled water to 1,000.0 cm³ [can be obtained ready-made from Grubler (Hollborn)]. Stain solution: Giemsa solution (Grubler) - 10 cm³, distilled water - 40 cm³, buffer solution - to 100 cm³. Stain for 1 hour; old slides - up to 2 hours. Wash with buffer solution. Dry. Pathological granularity of neutrophils with carbol-fuchsin-methylene blue staining according to Freifeld. With carbol-fuchsin-methylene blue staining, the protoplasm of normal neutrophils and neutrophilic myelocytes is devoid of any granularity (see separate table, fig. 11), while pathological granularity in neutrophils (see separate table, fig. 12) and myelocytes is revealed in the form of violet-blue grains and clumps of various sizes and shapes - from dust-like granularity to rather large clumpiness. - Staining method. Two solutions are prepared: 1) 1.0 g of Fuchsin fur Bas. (Grubler) (basic) is dissolved in 15 g of 96% alcohol with heating; after the solution has cooled, 100 cm³ of 5% solution of carbolic acid (Acid. carb. cryst.) is added to it; 2) 1% aqueous solution of Methylblau med. pur. (Grubler). On a slide fixed for 3 minutes with methyl alcohol, freshly prepared the following composition is poured in a high layer: to 20 cm³ of tap water add 7 drops of the first solution, shake, then add 5 drops of the second solution and shake again. Stain for one hour, after which the slide is washed with water and dried with filter paper. - For successful staining, the vessel must be clean, without alkali or acid, and also that droplets from droppers are always of the same size. The drops of methylene blue must be the same among themselves, as well as the drops of carbol-fuchsin. In case of unsuccessful staining, if the nuclei of leukocytes turn out red, the slide can be restained for two minutes with methylene blue (5 drops of 1% methylene blue in 20 cm³ of tap water). Slides stained according to Giemsa are well stained with carbol-fuchsin-methylene blue (without preliminary staining), and vice versa. Staining of pathological granularity of neutrophils with carbol-fuchsin-methylene blue is infallible in terms of diagnosis; pathological granularity of myelocytes can be established only by this method. Staining with Carbolpyronin-Methyl-green. The stain solution (Pappenheim-Unna) can be obtained ready-made from Grubler (Leipzig) or the stain is prepared from its components as follows: Methyl-green cryst. gelb.-0.15 g, Pyronin-0.25, 96% alcohol-2.5, Glycerin-20.0, Acid. carb.-0.5, Aq. dest.-100.0. Both pyronin and methyl-green are basic dyes, the first of which stains basophilic substance predominantly, while the second stains nuclear chromatin. The protoplasm of lymphocytes and plasma cells is stained especially intensely in bright red (see separate table, fig. 8); a cell whose protoplasm is not stained red is definitely not a lymphocyte, but not vice versa, since any cell with basophilic protoplasm is stained in the same bright red color, e.g., erythroblast. Basophilic granularity of erythrocytes is also of bright red color. Nuclei of lymphocytes are greenish-blue, nuclei of leukocytes are violet. --Staining method: 1) fixation by heat or any fixing fluid; 2) staining for 5-10 minutes; 3) washing with tap water; further, usually. Oxidase reaction Winkler-Schultze. In the protoplasm of leukocytes, unlike lymphocytes, substances are found which are presumably of the nature of the oxidative enzyme oxidase, which when acted upon by the reagent described below lead to the formation of indophenol blue. 1) Fixing fluid: 1 part of 40% formaldehyde + 9 parts of 95% alcohol, fix for several seconds. 2) On the fixed slide is poured: a) for 3 minutes a slightly diluted 1% aqueous alkaline solution of α-Naphthol. The solution is prepared as follows: α-Naphthol when heated in distilled water rises to the top and floats in liquid form; at this moment a crystal of caustic alkali is added; then α-Naphthol dissolves in water; b) without washing or drying the slide, a 1% aqueous solution of Dimethylparaphenylenediamine is poured on it. After a few minutes, the granularity of leukocytes becomes dark blue. The slide is overstained with a highly diluted solution of Ziehl's fuchsin. The majority of neutrophils give a sharply positive reaction, and only individual neutrophils contain few oxidase grains; eosinophils all with positive reaction, while basophils give a positive reaction only in the stage of maturation - basophilic myelocytes. Part of mononuclears also gives a positive reaction (see separate table, fig. 13). As for myeloblasts, they give a positive oxidase reaction only at the stage of greatest maturity (transition to promyelocytes).
The so-called labile oxidase reaction (Nadi-reaction according to Graeff'), which is obtained without preliminary fixation after the action of an alkali-free solution of a-Naphthol in a 1% solution of Dimethylparaphenylendiamine, is performed on sections. Lymphocytes sometimes give a positive labile oxidase reaction. The peroxidase reaction was proposed by Kreibich and Fischel; it is obtained very well by Graham's method: fixation with a solution of 1 part of 40% formalin + 9 parts of 95% alcohol; then the preparation is slightly washed with water and a solution of benzidine is poured on it for 5 minutes. The latter is prepared as follows: to 10 cm³ of 40% alcohol, a few crystals of benzidine and 0.02 cm³ of hydrogen peroxide (pipette from Sahli's hemometer) are added; then wash off. Usually a positive reaction is revealed in the form of golden-brown grains, less often bluish (first stage of benzidine action). It can be counterstained with thionin, indigo or azur-eosin. Only fresh preparations are stained; stained preparations are preserved for a long time. The results of staining in general are the same for oxidase and peroxidase reactions (see separate table, fig. 14). Various modifications of the peroxidase reaction have been proposed, e.g., Naphthol-peroxidase reaction (Loele); the technique proposed by Epstein also gives good results.-Epstein's method: 1) fixation of a blood smear (not older than 48 hours) with a mixture of Alcohol (95°)-90.0, Formol (40°)-10.0; 2) wash with distilled water (15-20 sec.); 3) pour on for 3 min. a solution of: Alcohol (40°) 100.0 + a-Naphthol-1.0 + +3% H₂O₂-0.2 (according to Graham); 4) wash with distilled water; 5) stain for 15 min. (up to 14 hours) in the following solution: Toluidinblau-1.0, Lith. citricum-1.0, Aq. dest.-100.0; 6) quickly wash with distilled water (1 sec.); 7) wash in a 1% solution of tannin (1 sec.); 8) dry with filter paper. The granules of neutrophils, eosinophils and mononuclears giving a peroxidase reaction are stained in a bright green color. Erythrocytes are greenish; otherwise the characteristic color of an azure-containing mixture. Detection of lipoids in the granules of leukocytes. Sehrt proposed a special method for staining Sudan smears of blood; with the help of this staining, it was found that the granules of both neutrophilic and eosinophilic leukocytes, as well as mononuclears, are sudanophilic, i.e., they give a characteristic lipoid staining. A modification of this staining by Goldman gives very good results; Goldman established that the granules of leukocytes that stain with Sudan always give an oxidase reaction.-Staining method. 1) Fixation of a fresh blood smear for 3 min. with a solution of 1 part of Formol (40°) and 4 parts of Spirit, vim rect.; 2) wash with distilled water; 3) wash off with a weak alcoholic solution (30-40°); 4) stain for 15 min. with the following solution: Spiritus 70°-100.0 + H₂O -20.0 + + Sudan III (in excess) + a-Naphthol 1.2 + + H₂O₂(3%)-0.3 (alcoholic solution of Sudan and a-Naphthol is boiled for 5 minutes; hydrogen peroxide is added to the cooled solution); 5) wash with distilled water; then the author stains the nuclei for 1-3 min. with hematoxylin Weigert's (5 drops of hematoxylin + 2-3 drops of Liq. ferri sesquichlorati). The best nuclear staining is given by Carozzi's hematoxylin [0.25 g crystalline hematoxylin + 0.025 potassium iodate (KJO₃) +1.0 potassium alum +25.0 glycerin + 100.0 distilled water]. Staining results: granules of neutrophils, eosinophils and mononuclears are of a bright orange-red color.-Histogenetic study of the formed elements of blood is carried out mainly on embryological material and experimentally. Stains for sections from tissues and organs are the same as for smears, adapting them accordingly to histological technique. In recent years, the development of blood cells is also studied by the method of tissue cultures. E. Freyfeld. VIII. Physico-chemical properties of blood. Blood is a viscous opaque liquid of red color, with a salty taste. The specific gravity of blood is 1.050-1.060; according to Bamberger, for men-on average 1.057.5, for women-1.053; according to Schmaltz-1.059, resp. 1.055. The specific gravity depends mainly on the number of erythrocytes or Hb, less on the properties of serum. The specific gravity of erythrocytes is 1.090, of serum-1.028-1.032, of plasma-1.029-1.034. The specific gravity of serum is determined mainly by the protein content, as their percentage content significantly exceeds the content of other dense substances in serum (urea, sugar, NaCl). Fluctuations in the content of sugar, urea, bile pigments, fat even under pathological conditions cannot significantly change the specific gravity of serum.-Under physiological conditions, an increase in the specific gravity of blood is observed with strong physical exertions, under the influence of heat, when fluids are withdrawn. These changes, however, are quickly equalized. In the morning, the specific gravity of blood is slightly higher than in the second half of the day. In pathology, thickening of blood with a corresponding increase in specific gravity is described in cancer of the esophagus and pylorus (up to 1.070), in prolonged diarrhea (in cholera, dysentery-up to 1.080), in severe burns (up to 1.073). In cholera, the determination of the specific gravity of blood has, according to Rogers, the significance that an increase to 1.063 represents an indication for intravenous infusions. Less significant increases in specific gravity accompany erythrocytoses in congenital defects, decompensation of heart defects. A decrease in the specific gravity of blood is characteristic of the impoverishment of blood with formed elements, hence for anemias, in which the specific gravity falls to 1.040 and below, approaching the normal specific gravity of serum; a decrease in the specific gravity of serum is observed in its impoverishment with proteins on the basis of renal and cachectic edemas. In general, in modern clinical practice, in most cases, the determination of the specific gravity of blood and serum is replaced by counting erythrocytes, determining Hb and refractometry of serum, which give a more direct answer to those main changes in the composition of blood that predominantly influence fluctuations in specific gravity. Technique for determining specific gravity. In Schmaltz's picnometric method, blood (about 0.1) is drawn into a chemically clean special capillary, weighed and then the weight of exactly the same volume of distilled water is determined in this same capillary. Hammerschlag's areometric method consists in allowing blood to fall drop by drop into a liquid whose specific gravity approximately corresponds to blood (a mixture of chloroform with specific gravity 1.485 and benzene with specific gravity 0.88), observing whether the drop falls or sinks in this mixture, by inappropriately adding one or the other ingredient, a mixture is obtained in which a new drop of blood remains suspended; the specific gravity of this mixture is determined with an areometer, which also shows the specific gravity of the blood under investigation. Rogers accelerates the determination by preparing a series of mixtures of glycerin with water with specific gravity from 1.040 to 1.070. By placing drops of blood in separate mixtures, the specific gravity of blood is easily determined. Barbour and Hamilton determine the specific gravity of blood, as well as other liquids, by the time of fall of a drop of the liquid under test through a certain layer of a mixture of xylene and brom-benzole compared with the time of fall of standard solutions of K₂SO₄. E. Tareev. The viscosity of blood depends on 1) the viscosity of plasma, 2) the number of erythrocytes and their volume, 3) the Hb content, 4) the amount of CO₂ in the blood, 5) the salt composition of plasma and other conditions. A particularly close dependence is noted between the volume of erythrocytes and the viscosity of blood. According to Frey, the volume of erythrocytes in volume percent=2.4η², where η is the viscosity value (see Viscosity, Viscosimetry).-The surface tension of blood, both whole and defibrinated, is less than the surface tension of water. The difference between the surface tension of blood, plasma and serum is very small. With a decrease in temperature, surface tension increases. When determining the surface tension of serum, first higher values are obtained than in repeated determinations. After about half an hour from the first determination, the smallest value is obtained. The largest value is called dynamic surface tension, the smallest-static. For normal human serum, the value of static surface tension=58-57 dyn/cm at 16-18° and 47 dyn/cm at 37°. The surface tension of blood under pathological conditions undergoes significant changes: it decreases in eclampsia, uremia, in cardiovascular diseases, in the presence of bile salts in blood, with an increase in CO₂ content in blood, etc. An increase in surface tension is encountered significantly less frequently. It has been noted that the surface tension of serum giving a positive RW is increased. However, the data presented on changes in the surface tension of blood cannot be considered firmly established and require verification. The osmotic pressure of serum and defibrinated blood is the same and represents under normal conditions a very constant value.
The maximum fluctuations under physiological conditions correspond to Δ -0.54-0.59°, on average -0.56°, in gram-molecules of osmotic concentration of serum = = t^ = гИ!= 0.3 gram-molecules. In different parts of the circulatory system, the Δ of blood can have different values; for example, in v. portae Δ =0.692-0.602°; in vv. hepaticae Δ = 0.722-0.633°; CO2 increases Δ. The main place in the osmotic concentration of blood belongs to crystalloids, first of all NaCl (about 60%). The share of serum proteins accounts for only 0.01° of the Δ value. During pregnancy, Δ decreases, averaging 0.54°, and in various forms of nephritis it increases to 0.60-0.71°. Of the components of serum, NaCl has the main significance for electrical conductivity, just as for osmotic pressure; its content in serum determines about 63% of the total electrical conductivity; of the remaining 37%, the largest share belongs to bicarbonates. The electrical conductivity of serum is quite constant and changes significantly only in pathological cases. A change in CO2 content in blood does not affect the electrical conductivity of serum, which is explained by the complex processes of ion exchange between erythrocytes and plasma when the CO2 content in blood changes (see below). Little is known about the physiological influences on electrical conductivity of serum; muscular work apparently increases the electrical conductivity of serum, the effect of nutrition remains unclear. Pregnancy does not change electrical conductivity. The electrical conductivity of plasma and serum is the same. The electrical conductivity of blood is much less than that of serum, since the ability of formed elements to conduct current is negligible. Animals A. 10-* Plasma A. 10-* Blood A. ю~* Pulp of formed elements 105.3 103.7 112.9 107.4 63.4 62.8 36.9 43.3 1.63 1.67 1.70 2.17 The once existing opinion that the electrical conductivity of blood corpuscles could be taken as 0 proved to be incorrect: by an indirect method, Heber (Høber) managed to show that the electrical conductivity of the endoglobular content of erythrocytes corresponds to the content of NaCl in solution in the amount of 0.2%. Determination of electrical conductivity gives an idea of the total sum of ions. At present, methods have also been proposed for determining the concentration of individual types of ions. -The method for determining the ionic concentration of alkali metals is based on the general principle of concentration cells (see Gas chain), and its peculiarity lies only in the preparation of the corresponding electrodes. Michaelis (Michae-lis) uses electrodes made of alkali metal amalgam, which remains without access to air in a special vessel, making it possible to renew the surface of the electrode, which oxidizes in the air, as needed. P r i p a r a t i o n of the electrode: in vessel A (Fig. 3) about 200 cm3 of clean and dry mercury is placed; having cut out several pieces (about 5 g) of Na or K with a cork drill, they are quickly transferred to tube a. The vessel A is evacuated several times, filled with hydrogen, the free end of tube a is sealed, it is slightly heated, allowing the molten metal to flow into the mercury, and the capillary K is sealed. After mixing the contents of vessel A, tubes b and d are connected with rubber, vessel B is evacuated through passage E, cock H is opened and the amalgam is allowed to flow into reservoir B; the remaining free part of reservoir B is filled with hydrogen through cock H. By turning cock Hs, tube I is filled with amalgam, serving as an electrode. When determining, after immersing the electrode in the liquid, the latter is connected with a tube filled with agar with potassium chloride to a saturated KCl solution, into which the tip of a calomel half-element is lowered. (Fig.-see on p. 675-676). The method for determining the concentration of hydrogen ions in blood or plasma has become widespread. Three different methods have been proposed: 1) electrometric (see Gas chain, Active reaction), 2) colorimetric (see Indicator method), 3) gasometric.-1. Bigwood considered the only correct method for electrometric determination of the concentration of H-ions in blood to be the study of plasma, separated from formed elements at the same O2 and CO2 pressure that was in the blood. In precise work, before each determination, the electrodes must be replatinized. 2. Colorimetric method for determining the active reaction of plasma according to Cullen. Necessary reagents: 1) Standard phosphate solutions, prepared according to the table. т/15 т/15 т/15 т/15 pH Na2HPO4 pH Na2HPO4 KH2PO4 cm3 cm3 cm3 7.00 61.1 38.9 7.45 82.5 17.5 7.05 63.9 36.1 7.50 84.1 15.9 7.10 66.6 33.4 7.55 85.7 14.3 7.15 69.2 30.8 7.60 87.0 13.0 7.20 72.0 28.0 7.65 88.2 11.8 7.25 74.4 25.6 7.70 89.4 10.6 7.30 76.8 23.2 7.75 90.5 9.5 7.35 78.9 21.1 7.80 91.5 8.5 7.40 80.8 19.2 2) Indicator solution: in a measuring flask with a capacity of 100 cm3, to 95 cm3 of 0.9% NaCl solution, 1.05 cm3 of 0.04% phenol red solution and a few drops of 0.2 n NaOH are added to pH = 7.4-7.6; the flask is filled to the mark with NaCl solution.-M e t h o d of determination: to 5-20 cm3 of solution No. 2 in test tubes with a flat bottom, paraffin oil is added, under the layer of which 0.4-1.0 cm3 of plasma is released. After mixing the contents of the test tube, the resulting color is compared with the color of the standard solution + indicator in a Walpole comparator; pH for t°38° is calculated by the formula: pH38=pH found at the temperature of the experiment +0.01 (tc-20°) - 0.23; the temperature at which the determination was made is measured by immersing a thermometer in a test tube with diluted plasma. 3. Gasometric method for determining blood pH, proposed by Hasselbalch, is based on the following provisions. The active reaction of blood has significant constancy, which is due to 1) the peculiarities of its chemical composition (see Buffer properties of blood) and 2) a number of physiological processes (respiration, work of kidneys, glands of the digestive tract, etc.). Of the mineral components of blood, bicarbonates (NaHCO3 + CO2) and phosphates (Na2HPO4 + +NaH2PO4) have a buffering effect; however, the latter are of only secondary importance, since their concentration in blood is very small (about 3 millimoles). For CO2 in the presence of bicarbonates in solution, the equation is indeed: '[CO2]' where [H'] is the concentration of H ions, [Bic] is the concentration of NaHCO3 salt; [CO2] is the concentration of carbonic acid, α is the degree of dissociation of bicarbonate at the given \°; K is the first dissociation constant of carbonic acid. Introducing instead of K the notation 10~~Pg and taking the logarithm, we get: -pH+log^ + logα - pK, where pH = - log [H*]; hence: pH≈pKa + logg£j.....
(1), where Vh = pl + log a. In normal conditions, deviations of pKh from the average values (6.10 at 38°; 6.18 at 20°) do not exceed ±0.03. It is therefore sufficient to find the concentration of CO2 present in plasma in a dissolved state [CO2], and the concentration of bicarbonates [Bic], i.e., the value of the fraction \т^~\, to have all L^o2J data for calculating pH. The determination of the value of the fraction Lic": constitutes the gasometric method for determining pH. The amount of free CO2 in plasma depends 1) on the tension of carbonic acid in B. and 2) on the coefficient of solubility (see Blood gases). In volume percent, the amount of dissolved CO2 is equal to ™^--0.1316 pa.....(2), where p is the pressure of CO2; a is the coefficient of solubility.-The concentration of bicarbonates, expressing it in volume % CO2, is found by subtracting from the total amount of carbonic acid the part of it that is in a dissolved state: [Bic.]-CO2-0.1316 pa... (3). The magnitude of the product 0.1316 a at different t° can be judged from the table. Temp. According to Bohr According to Van Slyke and McLean 15° 20° 25° 30° 38° 0.1307 0.1128 0.0975 0.0855 0.0712 0.1225 0.1057 0.0913 0.0800 0.0668 When working not with plasma, but with B., the value of a for serum must be corrected by an amount depending on the amount of O2 in the blood: a for blood=(1-0.00677h) a for serum, where h is the amount of O2 in volume percent (v%). Substituting expressions (2) and (3) into equation (1), we obtain: Thus. to calculate pH it is sufficient to know the pressure of CO2 in B. and the total amount of CO2 in plasma, expressed in v%.-The pressure of CO2 in B. can be determined by several methods. 1. The direct method was proposed by Krogh and consists in that a small vessel with a capacity of about 2 cm3 (microtonometer; fig. 4) is filled to the top with B. through the curved end (as substances preventing blood clotting, hirudin, heparin, Na2C2O4, NaF are used) and is sealed at the top with a thermometer inserted into rubber, which has a cup at the end. The cup carries with it an air bubble, which is shaken with the blood at 38° to equalize the pressure of gases, and then is transferred to Krogh's microapparatus (fig. 5), previously filled with acidified physiol. solution. An essential part of the gas analysis apparatus is a calibrated narrow glass capillary, which at the bottom ends in a small funnel and has a side passage closed with a screw. After shaking, the bubble r is left near the curved end, which is then introduced into the funnel (1) of the microapparatus filled with physiol. solution. By inserting the thermometer deeper into the tonometer, the bubble r is expelled from the tonometer and transferred to the funnel (1). Further, by turning the screw S, the bubble r is drawn into the capillary, where its volume is measured at a certain t°; after this, placing the apparatus in an inclined position, the physiol. solution is aspirated from the funnel and replaced with a 10% solution of caustic alkali. The apparatus is again placed in a vertical position, and by turning the screw S, the bubble is carefully brought into contact with the alkali; watching so that the alkali does not flow into the capillary, the screw h is turned and the bubble is moved up and down for better absorption of CO2. Leaving the bubble in the lower part of the capillary, the alkali is aspirated, replaced with physiol. solution, and, by drawing the bubble back into the capillary, its volume is measured. The difference between the 1st and 2nd readings after correction for t° gives the amount of CO2 contained in the bubble. Knowing the initial volume of the bubble (1st reading), the percentage content of CO2 in it is calculated, and knowing the atmospheric pressure, the partial pressure of CO2 is calculated. The accuracy of the analysis depends mainly on the purity of the capillary. The tension of CO2 in B. can be determined indirectly as follows: in a sample of B., taken with the necessary precautions for gas analysis, the total amount of COs is determined either by evacuation (see Blood gases), or in Barcroft's apparatus (see Barcroft's apparatus), or by Van Slyke's methods (see Van Slyke's methods). Then several samples of B. (usually three) are saturated with gas mixtures containing different amounts of CO2. In the blood saturated with a gas mixture of one or another composition, the total amount of COg is determined by the same method as before, and the data obtained in v% are plotted graphically, plotting the found values on the ordinate axis. The pressure of CO2 in the gas mixtures used for saturation is also determined (expressing the pressure of CO2 in mm of mercury column), and the obtained data are plotted on the abscissa. By connecting the points located in the coordinate system, a curve is obtained representing the binding of COg by blood at various pressures of the latter.-Example of arterial blood analysis: total amount of CO2 in B. without preliminary saturation-50»%; total amount of CO2 after saturation: at partial pressure of CO2-31 mm-45.5»%, at partial pressure of CO2-38.5 mm-49.0»%, at partial pressure of CO2-45.0 mm-52.8»%.-The graphical representation of the obtained results gives the curve ab (fig. 6). If from the point of the curve corresponding to the total amount of CO2 found without preliminary saturation, a perpendicular is dropped to the abscissa, then the intersection point of these two lines will indicate the pressure of CO2 that was in B. (40 mm). Some difficulties arise in determining the pressure of CO2 in venous B. by this method. Blood containing reduced Hb binds more CO2 than oxidized (by 5-6 v%); the CO2 binding curve of the first lies higher than the second (fig. 7). To pass to the CO2 binding curve of oxygen-saturated blood and the curve characteristic for venous B. (to introduce a correction for viscosity), for each missing volume percent of O2 up to full saturation, the CO2 binding curve should be raised, according to some researchers by 0.34v%, according to others by 0.27v%, on average by 0.3v%. By introducing the appropriate correction, the CO2 binding curves and the total amount of CO2 can be used to determine the tension of CO2 in venous B. A more complex method is saturation with a gas mixture containing oxygen under pressure corresponding to the tension of this gas in the venous B. being examined.-The pressure of CO2 in B. can also be judged from the analysis of alveolar air. It is considered that the data from the analysis of alveolar air by Haldane's method correspond to the tension of CO2 in arterial B., and by Plesch's method-in venous. With confidence, analyses of alveolar air began to be used to judge the pressure of CO2 in B. after verification of the obtained data by direct determination according to Krogh. Having determined the tension of CO2 in B. by any method and using formula (2), the amount of CO2 dissolved in plasma in v% is calculated. In the example given, v% CO2=0.1316a.40. To find the amount of CO2 in a bound state, i.e., the term [Bic.], the total amount of CO2 found in plasma without preliminary saturation should be subtracted from the amount of CO2 dissolved in plasma. It is also recommended to determine the CO2 binding curve not with whole B., but with plasma; for determining the tension of CO2, this is indifferent, only in one case the point corresponding to the total amount of CO2 in B. is sought on the binding curve, in the other-in plasma. When determining CO2 binding curves with plasma, it is necessary to saturate whole B. with a gas mixture, then, protecting B. from contact with air by means of a layer of paraffin oil, it is centrifuged and plasma (true plasma) is taken for analysis. If the amount of CO2 dissolved in B. is calculated for various pressures of CO2 and the obtained values are plotted graphically, a straight line is obtained, starting at the origin of the coordinate system and going at a small angle to the abscissa (the shaded angle doc in fig. 6 and 7 represents the amount of dissolved CO2 at various pressures). The distance from the points of curve ab (fig. 6) to the points of line od (e.g. h) located correspondingly with respect to the abscissa gives the expression (in v%) of the amount of CO2 in a bound state. The value h, corresponding to a CO2 pressure of 40 mm, is called the alkaline reserve of B. (see). If the concentration of hydrogen ions of B. is determined at a CO2 pressure of 40 mm, the resulting hydrogen index is called the reduced pH; the hydrogen index calculated according to the CO2 pressure that was found in B. is called the regulated pH. The simplest method for determining the CO2 binding curve of B. or plasma with carbonic acid was proposed by Fridericia.
A centrifuge tube a (fig. 8), containing 7-10 cm3 of blood, prevented from clotting by the addition of Na2C2O4 + NaF, is attached via a rubber tube equipped with a screw clamp C to cylinder B (capacity about 500 cm3), closed with a stopper through which a capillary tube with a stopcock D passes; clamp C is tightened. The cylinder is placed in a thermostat and evacuated with a water-jet pump until mercury rises in the manometric tube E to a certain level (e.g. 660 mm). Then, by turning the three-way stopcock F, cylinder B is connected to a gasometer filled with pure CO2, or to a Van Slyke apparatus, and CO2 is slowly introduced into B, controlling the amount by the drop of mercury in tube E. When the pressure has fallen by the desired amount (e.g. to 630 mm), stopcock F is turned to disconnect the gasometer and cylinder B; by turning stopcock H, B is connected to atmospheric air to equalize the pressure. With stopcock D closed, cylinder B is disconnected from the system of tubes; removing the rubber, clamp C is loosened; the cylinder is turned to a horizontal position and the blood is allowed to spread along the walls of the cylinder. By rotating the cylinder for 9 minutes, the blood is saturated with the gas mixture, then the cylinder is placed in a vertical position, allowing the blood to flow into the tube. Clamp C is tightened; depending on whether blood or plasma is being analyzed, either the rubber is cut below the screw clamp and the blood is immediately drawn for analysis (e.g. in a Barcroft apparatus) or the rubber is cut above clamp C and the clamp is loosened, after first pouring paraffin oil into the section of rubber above C. The tube is centrifuged, and the plasma that has collected above the formed elements and below the oil is taken for examination. When analyzing blood in tube a, it is sufficient to take 2-2.5 cm3 of blood. By introducing different amounts of CO2 into cylinder B, saturation is repeated with new portions of blood several times, and according to the procedure described above, several points on the carbonic acid binding curve of blood or plasma are obtained. The method for determining the CO2 binding curve, proposed by Straub, is designed for subsequent blood analysis in the Barcroft apparatus. Into tonometer O (with a capacity of 250-300 cm3) with stopcock B closed (fig. 9), 2-3 cm3 of blood are placed, after which the upper opening of the tonometer is closed with a stopper. Under pressure from a special burette A, the required amount of CO2 is introduced into the tonometer, stopcock B is closed, and the tonometer is placed in a thermostat (temperature 37-38°), where the blood is saturated with the gas mixture by shaking. After 10 minutes, by connecting the tonometer via stopcock B to a mercury manometer, it is determined how much the pressure inside the tonometer exceeds atmospheric pressure. Then the blood is allowed to collect in section A, and by turning stopcock B to connect with pipette EC, the latter is filled with blood. By turning stopcock B to connect with the blood, it is released under an ammonia solution into a small vessel of the Barcroft apparatus. For analysis of the gas mixture, the tonometer is connected to a Haldane gas analysis apparatus, into which the required portion is drawn and analyzed. -Example of calculating CO2 pressure in the tonometer: pressure in the tonometer increased by 60 mm; corrected barometer reading = 760 mm. Total pressure in the tonometer 760 + 60 = 820; minus water vapor pressure (47 mm) = 773 mm. The CO2 content found in the gas mixture = 773 × 0.03 = 0.3%; from which CO2 pressure = 0.3 × 773 = 2.32 mm Hg. Straub's method has no advantage over Friederich's method, since with the latter, for greater accuracy, the pressure of the gas mixture in the tonometer can be determined and the CO2 pressure can be secondarily controlled by analyzing the gas mixture in the Haldane apparatus. -When determining the active reaction of blood, a number of precautions must be observed when taking the blood and preserving it until analysis: blood, taken without any compression of the vessel into a syringe under paraffin oil, is transferred either through a needle or (after removing the needle) through a rubber tube into a test tube containing 3-5 cm3 of paraffin oil, on the walls of which a mixture of Na2C2O4 + NaF has been previously rubbed. The amount of the mixture of sodium oxalate and sodium fluoride (1:1), finely ground in an agate mortar, should be 0.2-0.3% of the amount of blood to be taken. After mixing the blood with a fused glass rod, the tube is placed in snow. If some time is expected to pass from taking the blood to analysis, it is desirable to close the tube, in which the blood is under a layer of oil, with a stopper having an opening for the oil to escape. This opening is closed with a glass rod when the stopper is inserted to the proper depth. In this form, blood can be stored for 5-6 hours. When examining plasma, the tube, closed as described, is centrifuged, and the plasma is carefully collected from under the oil after carefully opening the stopper. Returning to the question of the stability of the active reaction of blood, it should be noted that solutions of bicarbonate alkaline salts in the presence of free CO2 more easily change their inherent concentration of hydrogen ions than plasma, and the latter more easily than blood. The suspension of red blood cells has the most pronounced buffer properties. Investigated objects: CO2 pressure Difference 20 mm 40 mm NaHCO3..... Serum..... Pulp of formed elements of blood ! 7.64 ' 7.37 7.46 ! 7.27 7.15 I 7.04 0.30 0.27 0.19 0.11 The data in the table indicate that bicarbonates are not the only buffer system of blood. Hb has much greater significance. The importance of Hb as a buffer becomes clear when comparing the CO2 binding curves: 1) by a NaHCO3 solution, 2) by serum separated from formed elements at CO2 pressure = 44.55 mm Hg, 3) by plasma that was saturated with the gas mixture together with erythrocytes (true plasma), and 4) by blood (fig. 10). It turns out that serum, separated from erythrocytes, has a completely different ability to bind CO2 than true plasma and blood. Curve III intersects curve II only at one point, namely - corresponding to the CO2 pressure at which the serum was separated from the erythrocytes. Curve III runs similarly to IV. This is explained by the fact that when CO2 pressure increases in the blood, anions (Cl-) move into the formed elements, as a result of which the ability of plasma to bind CO2 increases. This ion movement process corresponds to Donnan's equilibrium rule (see Donnan equilibrium), and Hb plays the role of an ion incapable of penetrating through the membrane. At present, it can be considered proven that serum proteins also have a buffer effect: the ability of serum ultrafiltrate to bind CO2 was found to be significantly less than that of the part of serum that did not pass through the filter, i.e. enriched with proteins (fig. 11).-The constancy of the active reaction of blood is maintained by a number of physiological processes, of which respiration should be placed first. The slightest increase in CO2 tension in the blood, leading to a shift in the active reaction of blood in the acidic direction, causes an increase in pulmonary ventilation, consequently decreasing CO2 pressure and returning the blood pH to its original level. Under physiological conditions, changes in the active reaction of blood are insignificant and vary in narrow limits in different individuals: 7.30-7.44 at 38°. In pathological conditions, the concentration of hydrogen ions can change quite significantly. A shift in pH in the acidic direction is called acidosis (see), and in the alkaline direction - alkalosis (see). These terms are unsatisfactory, because first, the active reaction of blood does not sufficiently reflect the state of the body's overall acid-base balance; second, excessive accumulation of products of acidic reaction in the blood (e.g. lactic acid) is repeatedly observed, accompanied by a shift in pH in the alkaline direction. It should be borne in mind that the active reaction of blood depends on the most diverse factors: qualitative and quantitative composition of blood electrolytes, amount of plasma protein, number of formed elements, Hb concentration, O2 and CO2 pressure, and other conditions. A more or less correct assessment of the acid-base balance of blood can be made only by determining blood pH, CO2 binding capacity, Hb concentration, and total plasma base content. Van Slyke considers it sufficient to determine the total CO2 content of blood and the active reaction. Van Slyke depicts various changes in the acid-base balance of blood with the scheme shown in fig. 12 and 13. Legend for fig. 12: I - decompensated excess of alkali; II and III - decompensated CO2 deficiency; IV - compensated excess of alkali or CO2; V - normal acid-base equilibrium; VI - compensated deficiency of alkali or CO2; VII and VIII - decompensated excess of CO2; IX - decompensated deficiency of alkali. To evaluate shifts in the active reaction of blood, Henderson proposes the following terms: pH does not go beyond normal fluctuations - euhydria; pH is lowered - hyperhydria, elevated - hypo-hydria.-Blood gases - see Blood gases and Respiration (gas exchange in the lungs).
S.
Severin. IX. Chemical composition of B. The chemical composition of B. represents, despite the continuous influx and outflow of various kinds of gaseous, mineral and organic substances, a relatively constant magnitude. The constancy of certain chemical ingredients of B. the organism maintains with exceptional persistence—the so-called chemical constants of B. Such constants can include: the active reaction of B. (its pH), its freezing point (A, resp. the number of molecules dissolved in it), the ratio between individual cations and a number of others. Under physiological conditions, insignificant fluctuations in the chemical composition of blood are equalized by the organism itself with extraordinary speed by the most diverse means (respiratory and excretory organs and others). The following table gives an idea of the narrow limits within which the normal chemical composition of blood fluctuates. i _-L- ii-- iO ^-- ^r" IV j *0 !// 10-W- 1 -------1------- 10 20 30 40 50 60 70 80 90 10O pressure of CO2 in mm Hg 10 absorption pH
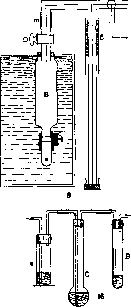
83
for connecting with atmospheric air to the gasometer
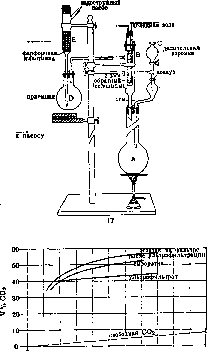
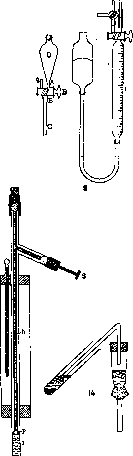

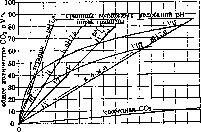
Normal composition of human blood (according to various authors). Volume and compositional parts
-
- 100-200 150-190 58-101 44-79 3.1-8.6 13.8-19 38.9-75 » » » » ,8 » » ,8 » » * Of this amount, about 60% is in the form of esters. Proteins. Proteins of blood plasma constitute about 6-8% of plasma or about 3Д of its dry residue; almost the same ratios hold for serum; in relation to whole B., plasma proteins constitute 3-4%. The main proteins of blood plasma are globulins and albumins. In these main groups, more or less distinct subgroups can be distinguished. The globulins of blood plasma include: 1. Fibrinogen, distinguished by a relatively low degree of dispersion, low salting-out boundaries [precipitates from five-times diluted plasma at 13-28% saturation (NH4)2S04], low coagulation temperature (56°), and the ability to convert to fibrin (during blood clotting). Fibrinogen constitutes 0.1-0.4% of plasma. In pathological cases, especially in diseases accompanied by leukocytosis (excluding leukemia), its content can increase (hyperinosis) to 1.5%; in malaria, pernicious anemia, leukemia, and some other diseases, a decrease in fibrinogen content (hypo-inosis) is observed, sometimes even reaching its complete disappearance (very rare cases). In relation to blood clotting, fibrinogen has very important biological significance. 2. Fibrin-globulin, also having low salting-out boundaries and low coagulation temperature, but remaining in serum after fibrin is separated; its amount is small; some authors consider that it is preformed in plasma, others—that it is formed at the moment of fibrinogen clotting. 3. Paraglobulin (2-3% of plasma), representing a mixture of globulins, which was separated by the school of Hofmeister by fractional precipitation with salts into two main fractions: a) euglobulin, precipitating at 28-36% saturation (NH4)2S04 and present in plasma in solution due to the action of protective colloids, and b) pseudoglobulin, precipitating at 33-46% saturation (NH4)2S04. The overlapping of salting-out boundaries raises doubts about the individuality of these fractions. - Serum albumin (4-6% of plasma) also apparently does not represent a homogeneous substance, as evidenced by the variable coagulation temperature, different salting-out boundaries, and different crystal forms. Attempts have been made to divide the albumin group into various fractions, for example, water-soluble and water-insoluble (pseudo- and eualbumins). The clotting temperature of serum albumin (70-85°) strongly depends on salt content. Serum albumin can be obtained in crystalline form (see Proteins). - Further, blood plasma contains nucleoprotein and seromucoid, present in small amounts (0.1-0.25 g in 1 l) and very little studied. Nucleoprotein precipitates into the globulin fraction during precipitation. Seromucoid belongs to glycoproteins; it does not coagulate upon boiling, and therefore can be mistaken for albumoses. It remains unclear to this day how many groups and which groups of globulins and albumins are present in blood serum. There are all possible gradual transitions from one fraction to another. It is possible that the matter lies not so much in chemical differences as in differences in the physicochemical state of one substance. It should be noted that the division into fractions is manifested not only in the above-mentioned properties but also concerns the serological, immune, and enzymatic properties of globulins. Not only the total amount of plasma proteins is important, but also the ratio of fractions, which changes significantly in many pathological processes. The ratio of globulins to albumins, the protein coefficient, is denoted by a fraction, equating the amount of globulins to 1; in normal conditions it ranges from 1:1.5 to 1:2.3. In addition, the expression "protein picture of the blood" (Bluteiweissbild) is used, which refers to the ratio of both fractions expressed as a percentage of their total amount; in normal conditions this ratio = 33/67; an increase in the relative amount of globulin is designated as a shift to the left in the protein picture of the blood. Finally, one can simply indicate the amount of globulin as a percentage of the total protein, for example 33%. There are indications that the amount of globulins increases in various immunization processes, but not proportionally to the degree of the immunization titer. In some pathological processes, especially in diseases accompanied by leukocytosis, the content of globulins in B. can become higher than the content of albumins. In nephritis, the protein coefficient can reach 1:11.3. - Little is known about the origin of blood proteins. Apparently, blood-forming organs (bone marrow) play a certain role in this process. Many observations point to the liver as an important organ for the formation of fibrinogen. A number of authors believe that all organs, not any specific ones, participate in the formation of blood protein, and that it represents a product of the breakdown of protein in these organs. The question of the genetic relationship between globulin and albumin, important for clarifying the mechanism of changes in the protein coefficient and which occupied a number of authors, has not yet been clarified. Quantitative determination of proteins can be performed by coagulating all proteins by boiling (desirable pH 5.5), weighing the washed and dried precipitate, and determining nitrogen in it by Kjeldahl's method (see Kjeldahl's method); multiplying the amount of nitrogen by the coefficient 6.25, one can with great approximation calculate the amount of protein. Using Kjeldahl's method, it is also possible to determine the nitrogen attributable separately to fibrinogen, globulin, and albumin (distribution of blood nitrogen). For this, nitrogen is determined in plasma, serum, filtrate after precipitation of globulins, and in the filtrate after precipitation of all proteins. Recently, a number of authors (Rona, Roshnyak) have proposed nephelometric determination (see Nephelometry). The refractometric method is very convenient. For B., one can speak of the refraction of plasma and serum. For the study of the refraction of blood plasma or serum, Abbe or Pulfrich refractometers are most suitable; the first gives directly the refractive index, the second—the so-called Pulfrich units—PE (1 PE corresponds approximately to Δn=0.00036-0.00038), with the help of which the refractive index can be found using tables. The refraction of blood plasma consists of the refraction of water (n for 17.5°-1.33320), the refraction attributable to the inorganic and organic non-protein components [in normal conditions Δn (increase in refractive index compared to the refractive index of water) = =0.00200-0.00277], and the refraction of proteins (in normal conditions Δn about 0.01800); for plasma, the refraction of fibrinogen (Δn - 0.00080) is added here. As can be seen, proteins have the greatest influence on refraction, and more dispersed albumins have a lower refraction than less dispersed globulins (refraction of albumins in 1% solution=0.00177, refraction of globulins in 1% solution=0.00229; Robertson). The refraction of human serum under normal conditions = 1.34873-1.35168. Under normal conditions and in most pathological states, the content of water and crystalloids in serum fluctuates within such narrow limits that fluctuations in refraction can be attributed to an increase or decrease in the amount of proteins (Reiss). The only exceptions are uremia and hyperglycemia, in which the amount of non-protein light-refracting substances in serum is greatly increased and must be taken into account when determining refraction. - For refractometric studies, capillary, venous, or arterial blood can be used, but it is essential that when taking blood, the vessels are not compressed to avoid mixing tissue lymph with the B. under study. - When studying plasma, the use of anticoagulants is absolutely unacceptable, as they change the refraction in a difficult-to-account-for way. Only the addition of a small amount of a good preparation of hirudin or heparin is possible. It is best to perform determinations in "so-called natural native plasma," i.e., plasma obtained by rapid centrifugation of whole blood in ice and in paraffinized tubes without prior addition of anticoagulants. - When studying serum, it should always be obtained in the same way, because depending on whether the serum was obtained by centrifugation of whole clotted blood or defibrinated blood or from natural plasma, its refraction values are different. Hemolysis is unacceptable anywhere. Since refraction depends on almost all components of B., its value is of little independent interest as a constant of one or another B.; rather, refraction studies are interesting because they make it possible to quantitatively determine proteins in a small amount of B. and to indirectly judge the water content in it. For this purpose, 3 methods have been proposed. I. Reiss's method.
Taking the refractive index of the non-protein part as a constant value - 0.00277, and that of a 1% solution of serum protein (a mixture of albumins and globulins) as 0.00172, Reis compiled a table with the help of which, having the refractometer readings in R.E. at 17.5°, one can directly find the percentage of protein. Subsequently, the figures of refraction on which Reis's table was based proved to be incorrect, and Robertson proposed using the constants: 0.00208 and 0.00195 (this last number corresponds to a protein mixture consisting of 2/3 albumin and 1/3 globulin, as is usually the case in serum). Despite this correction, Reis's method gives only approximate results, since the basic premises of it are incorrect; in reality: 1) the refraction of the non-protein part varies in different cases, 2) the refraction of a 1% solution of serum protein also does not appear to be a constant value and changes depending on the ratio of albumin and globulin fractions in the protein of a given serum.
G. Derviz. II. Robertson's method. In contrast to Reis, Robertson pointed out that the refraction of protein bodies is composed additively from the refractions of individual types of proteins (globulins, albumins). Robertson's method consists of three parts: determining the refraction of 1) the non-protein part of the serum, 2) albumins, and 3) globulins. 1) The refraction of the non-protein part of the serum is determined by boiling with an equal volume of 1/5 acetic acid and subsequent refractometric measurement of the filtrate. From the obtained number, the refraction of 1/5 acetic acid is subtracted. The difference, multiplied by 2, gives the refraction of the non-protein part of the serum. In view of the fact that the non-protein part consists mainly of NaCl, and other substances have a refractive index similar to NaCl, the obtained number is divided by 0.00160 (refraction of a 1% NaCl solution). Thus, the percentage content of the non-protein part, expressed in terms of NaCl, is obtained. 2) Determination of albumins. To the serum is added an equal volume of a saturated ammonium sulfate solution; globulins precipitate, albumins remain in solution. It is centrifuged, the transparent liquid is suctioned off, diluted with an equal volume of water, shaken and refractometered. From the obtained result, the refraction of the saturated solution (NH4)2SO4 is subtracted. The difference, multiplied by 4, gives the refraction of albumins and the non-protein part of the serum. Subtracting from this difference the number obtained in the first determination, and dividing the result by 0.00177 (refraction of a 1% albumin solution), gives the percentage content of albumins. 3) Determination of globulins. The refraction of the unchanged serum is determined, from which the refractions of distilled water at the same t°, the non-protein part, and albumins are subtracted, thus obtaining the refraction of globulins. Dividing the obtained number by 0.00229 (refraction of a 1% globulin solution), gives the percentage content of globulins. Berger based on the same principle the determination of pseudoglobulin and euglobulin. Robertson's method has several sources of error: 1) the refraction of a saturated (NH4)2SO4 solution is subject to fluctuations; 2) the methods of precipitating proteins by boiling with acetic acid and salting out globulins with half-saturation (NH4)2SO4 cannot be considered perfect; 3) the refractions for 1% solutions of albumin and globulin cannot be considered constant, since various types of albumins and globulins are contained in the serum, and in a given serum, certain types may predominate. Therefore, a constant value of refraction cannot be given for 1% solutions of globulin and albumin.
Yu. Gefter, G. Derviz. III. Rohrer's method. Rohrer's method is based on the fact that solutions of albumin and globulin differ greatly in viscosity. Rohrer proposed a table in a coordinate system, according to which, knowing for a given solution two physical quantities - its refraction and viscosity - one can find the percentage content of albumin and globulin in it. In the table, the refraction in R.E. is plotted on the ordinate, and the viscosity of the serum, determined with the help of a Hess viscometer (see Viscometry), is plotted on the abscissa. The results obtained by Rohrer's and Robertson's methods often do not coincide with each other, especially in pathological cases, but for clinical purposes they are sufficiently accurate. The Reis method is particularly quickly performed [in cases with varying amounts of non-protein components (e.g., nephritis) this method is not sufficiently reliable]. - Physiol. figures of refraction of Blood proteins. In normal conditions, the refraction of serum for a given individual fluctuates within relatively small limits (1-8 units in the 4th decimal place).-Normal average figures of refraction on an empty stomach in a calm state are as follows. I Newborn . ! 1.34575-4798 48-54
For fluctuations in the value of refraction, the following moments are particularly important: 1) water exchange between serum and formed elements and between serum and tissues; 2) increase or decrease of the non-protein part of the serum; 3) formation or consumption of proteins. - The value of refraction changes extremely little and randomly during the day, which affects only the tenths of a percent of protein. Drinking has a short-term effect on the value of refraction, as water is quickly eliminated into tissues or kidneys. Profuse sweating leads to an increase in refraction; in balneological heat procedures, there is a slight increase in refraction (up to 1 unit in the 3rd decimal place). Taking food has no effect on refraction, but with prolonged undernutrition, the amount of protein decreases. Moderate work and movement have little effect on refraction; with more strenuous work, more severe changes occur. When the body is overheated, a sharp left (see above) shift in the protein picture of Blood occurs.-During pregnancy, an increase in the globulin fraction is observed. Changes in refraction (i.e., concentration of proteins) in pathological cases may depend on a primary change in the amount of protein (hypoproteinaemia, hyperproteinaemia) or on a primary change in the amount of fluid in the blood (hydraemia). In immunization processes, the protein content in the plasma increases, and the globulin fraction increases.-In acute infectious diseases (influenza, pneumonia, scarlet fever, suppurations), first there is some decrease in protein, then an increase, which may last quite a long time; the increase affects the protein fractions in the following order: fibrinogen, globulins, and albumins.-In chronic diseases (e.g., tuberculosis), there is an increase in protein content, mainly concerning globulins. The protein coefficient decreases, the protein picture of Blood undergoes a left shift. In tuberculosis, the increase in the globulin fraction is proportional to the severity of the disease, which makes it possible to use refraction as a prognostic sign.-In neoplasms, a decrease in protein content is more often observed, but an increase also occurs, depending on the location of the tumor; under light treatment, the protein content usually increases, as breakdown products stimulate an increase in the globulin fraction. Changes in refraction and amount of protein resulting from a primary change in the amount of fluid are observed mainly in kidney diseases, gastrointestinal tract disorders, circulatory disturbances, metabolic disorders.-Kidney insufficiency leads to a decrease in refraction, which can be detected in the serum before edema occurs (refraction reaches 1.3518-1.3543). In stenoses of the esophagus and pylorus, when food intake is difficult, refraction sometimes rises to 4 units in the 2nd decimal place. In diarrhea, refraction varies differently. In compensated heart diseases, refraction does not change; in developing decompensation and an increase in CO2 in the blood, it falls due to the entry of water from formed elements and tissues into the plasma. In diabetes, acidosis, there is also a decrease in refraction (acidification, for example when injecting acidic buffer solutions, leads to significant hydraemia).
G. Derbiz. Carbohydrates in B. In B. there are glucose, ^-fructose and very small amounts of glycogen (2-5 mg%); the content of maltose, isomaltose and pentose in B. has not been proven with certainty; when sucrose and lactose are introduced per os, these carbohydrates may temporarily * appear in the blood. Some authors have suggested that glucose in normal B. is not the usual equilibrium mixture of 2 stereoisomeric forms: alpha- and ^-glucose, but represents an unstable, easily cleavable gamma-glucose that appears under the combined action of the liver and pancreas; in diabetes mellitus, in the opinion of these authors, there is no gamma-form, which alone can be destroyed by cells, unlike the alpha- and beta-forms. This assumption is not sufficiently substantiated, [just as the opinion of some authors that a significant part of the sugar is in the plasma in a bound (with proteins) form; if such sugar exists in B., it is only in very small amounts compared to free glucose. That blood sugar is glucose was proven in 1846 by Magendie. Michaelis, Rona and others showed that contrary to previous opinion, erythrocytes also contain sugar, the amount of which varies considerably in different species of animals. In individual species of animals, the amount of glucose in plasma ranges from 0.05% to 0.2%; in healthy people in B. - from 0.08% to 0.116%; in plasma: 0.098-0.114%. Arterial B. contains 0.01-0.02% more glucose than venous blood. After fermentation of blood sugar by yeast, the reducing capacity of B. remains, which is called residual reduction and may be due to the content of glucuronic acids and other both non-nitrogenous and nitrogen-containing substances in the blood. The magnitude of residual reduction under normal conditions is small (0.005%). The amount of sugar in the blood of animals and humans can vary under various conditions. Determination of the amount of sugar in the blood, along with the study of urine, is of great importance for clinical practice, since by determining the sugar in B., it is possible in the absence of glycosuria to detect latent cases of carbohydrate metabolism disorders. There is no definite relationship between the amount of sugar in B. and in urine; the permeability of the kidneys for sugar varies. Compared with a single determination of sugar in B., which is performed on an empty stomach, a better picture of the degree of carbohydrate metabolism disorder is given by the construction of sugar curves, i.e. determination of sugar in B. at known intervals after glucose loading. An increase in the sugar content in B., hyperglycemia, occurs when feeding large doses; this phenomenon is transient and is called alimentary hyperglycemia; usually within a few hours the blood sugar level returns to normal. Temporary hyperglycemia develops after Bernard's sugar injection (see) and can occur under the influence of strong emotions, anesthesia, bloodletting, the introduction of caffeine, diuretin, adrenaline, etc., in poisoning with carbon monoxide, arsenic, mercury, morphine, amyl nitrite, etc. Hyperglycemia occurs in febrile conditions, in organic diseases of the brain, in its concussion, in mental diseases, in skin diseases. The strongest and most persistent hyperglycemia (up to 0.4%, rarely higher) and the greatest deviations of sugar curves from normal are observed in diabetes mellitus (see). In addition to lesions of the pancreas causing diabetes, dysfunction of other endocrine glands can also lead to hyperglycemia, which is observed, for example, in Basedow's disease, lesions of the pituitary gland, especially in diseases with acromegalic symptoms; repeated injections of pituitary extract, electrical stimulation of the pituitary gland cause hyperglycemia. In nephritis, an increased sugar content in the blood is often observed, and glycosuria is often absent, which is explained by the fact that in kidney disease their permeability for sugar decreases. Hypoglycemia occurs much less frequently than hyperglycemia. Hypoglycemia is observed during prolonged fasting, in dropsy, in Addison's disease, after removal of the liver, in myxedema, cretinism. For clinical practice, the greatest importance is hypoglycemia that develops as a result of insulin injections (see).- During muscular work, the amount of sugar in B. increases, but if this work leads to exhaustion, then on the contrary hypoglycemia can occur due to increased use of glycogen reserves, e.g. after a marathon run (see Metabolism, carbohydrate). Yu. Gefter, S. Severin. For determining the amount of sugar in B., several methods have been proposed; of these, at present the most common in clinical and laboratory practice is the Hagedorn-Jensen method, the principle of which is as follows: to the protein-free B. filtrate is added a titrated solution of potassium ferrocyanide K8Fe(CN)6; the potassium ferrocyanide K4Fe(CN)6 formed after oxidation of glucose precipitates in the presence of zinc sulfate; the excess K8Fe(CN)6 that did not enter into reaction with glucose is determined iodometrically according to the following equation: 2KaFe(CN)6+2HJ = 2K4Fe(CN)6+ I2. To determine sugar, 0.1 cm3 of blood is sufficient. The necessary reagents (not containing impurities of iron salts): 1) 0.45% solution of zinc sulfate; 2) n/10 solution of NaOH; 3) 1.65 g K3Fe(CN)6+10.6 g anhydrous Na2CO3 are dissolved in 1 l of distilled water; 4) 50.0 g ZnSO4+250.0 g NaCl in 1 l of distilled water; when using this reagent, KJ is added to it in an amount of 2.5%; 5) 3% acetic acid (not containing iron); 6) soluble starch; 7) n/20 solution of hyposulfite (Na2S2O3).- Method of determination: to precipitate the proteins of B., 1 cm3 of n/10 solution of NaOH (2) and 5 cm3 of 0.45% solution of ZnSO4(1) are introduced into a test tube. A white flocculent precipitate of zinc hydroxide forms. After adding 0.1 cm3 of blood, the test tube is 2 times rinsed with the mixture in the test tube and left for three minutes in a boiling water bath. The protein coagulates. To the protein-free quantitatively collected filtrate, 2 cm3 of solution No. 3 are added and heated in a boiling water bath for 15 minutes. After cooling, 3 cm3 of solution No. 4, then 2 cm3 of acetic acid (No. 5) and a few drops of starch solution (No. 6) are added. The liberated free iod is titrated with n/100 solution of hyposulfite (No. 7). The titer of hyposulfite is checked against a precise n200 solution of acid potassium iodate (KIO3+HIO3). In parallel, it is necessary to set up a control (blind) experiment, i.e. to carry out the determination as indicated, without adding blood. The calculation is made using the attached table. The table is used as follows: in the left column (extreme) find the number of whole and tenths of cm3 of n/200 solution of Na2S2O3 spent during titration, and in the upper horizontal row - the number of hundredths. The value found at the intersection of the lines drawn from these numbers in the table indicates the amount of mg of sugar in 100 cm3 of the blood taken for analysis. Example.
When titrating the contents of the control tube, 1.98 cm³ of a 2M Na₂SO₃ solution was used, which corresponds to 0.003 mg of glucose. When titrating the contents of the tube with blood, 1.43 cm³ was used, which corresponds to 0.101 mg of glucose. The amount of sugar in 0.1 cm³ of blood = 0.101 - 0.003 = 0.098 mg, or 98 mg%. Lipoids are studied in the ether or alcohol-ether extract of blood. In the normal state in the blood serum of a fasting human, the individual components of the ether extract are distributed as follows: total amount of fatty acids - 0.25-0.47%, on average - 0.38%; neutral fat - 0.04-0.2%, on average - 0.11%; lecithin (phosphatides) - 0.17-0.26%, on average - 0.2%; cholesterol - 0.18-0.31%, on average - 0.2%. The ratio - lecithin/cholesterol - being quite...
^ but constant, equal to 0.82-0.96. The total amount of ether extract of plasma is 0.72 g per 100 cm3. The content in the blood of the substances mentioned depends little on age, sex, but extremely fluctuates depending on the nature of nutrition. When fats are introduced into the body, all parts of the ether extract sharply increase (alimentary lipemia), which can often be determined already by the external appearance of the serum, noticeably opalescent in these cases. During starvation, the amount of lipoids in B. first increases, then with developing exhaustion falls below normal. With dietary regimens poor in fat, the content in the blood of substances extractable by ether remains at a low level (see also Lipemia).-Cholesterol in B.-see Hypercholesterolemia. Lecithin in B. in some respects is antagonistic to cholesterol (e.g. causes hemolysis, increases the stability of the suspension of erythrocytes, etc.). Methods for determining lipoids in B. were proposed by Bang and then modified by numerous researchers, but even to the present time they cannot be considered technically simple and sufficiently accurate. When determining lipoids in B., the purity of the vessels and reagents is of particular importance. Determination of fatty acids and cholesterol, according to Bang, in Bloor's modification is based on the oxidation of fatty acids and cholesterol by chromic acid solution, the excess of which is determined by iodometric titration. The reducing capacity of palmitic acid is 3.51; oleic acid-3.61; stearic acid-3.66; cholesterol-3.92; lecithin-3.11; cephalin-3.12. The numbers indicate the amount of cm3 of 10 solution of bichromate, which is restored by one mg of substance. Reagents: 1) and/10 solution of Na2SsOa; 2) n solution of potassium bichromate K2Cr2O7(4.904 g to 1,000 cm3 water); 3) starch solution; 4) 10% solution of KJ; 5) solution of silver bichromate in sulfuric acid: to 25 cm3 of 25% solution of AgNO3 in a large centrifuge tube add 50 cm3 of 10% solution of K2Cr2O7; the precipitate of Ag2Cr2O7 is centrifuged and the liquid collecting above the precipitate is washed several times with water and then dissolved in 500 cm3 of concentrated H2SO4; 6) petroleum ether (boiling point 60-70°); 7) ether-alcohol mixture: 3 parts of 95% alcohol are mixed with 1 part of ether (both reagents are distilled twice); 8) sodium ethylate, approximately n solution: 2-3 g of metallic Na are dissolved (cooling with ice) in 100 cm3 of absolute alcohol (the solution is kept in the dark).- Procedure of determination. Extraction: to 3 cm3 of plasma placed in a 50 cm3 volumetric flask, gradually, with constant stirring, add 40 cm3 of ether-alcohol mixture (7), place in a boiling water bath until boiling begins, then cool and, making up to the mark with ether-alcohol mixture, filter through a defatted filter. - Determination of the total amount of lipoids. In a 100 cm3 Erlenmeyer flask to 15-20 cm3 of the obtained filtrate add 2 cm3 of sodium ethylate solution (8) and heat on a water bath until the smell of alcohol disappears. The residues of alcohol are removed by suction of air. To the viscous content add 1 cm3 of H2SO4(1:3), heat on a water bath for 1 min, and extract the obtained solution for 2-3 min with the help of 10 cm3 of boiling petroleum ether. Pour the petroleum ether into a 25 cm3 volumetric flask. Repeat the extraction 3-4 times with portions of 5 cm3, which are poured into the same volumetric flask. After cooling, the liquid is made up to the mark with petroleum ether and stoppered extract No. 1 (E. 1). - Oxidation. 10 cm3 of extract (E. 1) are evaporated in an Erlenmeyer flask, fitted with a ground stopper, until the smell of petroleum ether disappears, from the residues of which it is freed by blowing air through the flask. To the residue add as a catalyst 5 cm3 of silver bichromate solution in sulfuric acid (5), 3 cm3 of n solution of potassium bichromate (2) and place for 5 min in a drying oven at t° of 124°.-Place under the same conditions a blank test with only the reagents as a control. Removing the flasks, shake their contents, tightly close with ground stoppers and place again in the oven for 10-15 min. Removing the flasks, into them, without cooling, pour 75 cm3 of water, 10 cm3 of 10% solution of KJ and quickly titrate with and/10 solution of hyposulfite, avoiding shaking at the beginning of titration to avoid loss of iodine. At the end, shake vigorously, add starch solution and titrate until the blue color disappears. The difference in the amount of cm3 of n/10 solution of hyposulfite spent on titration after treating only the reagents (blank test) and the analyzed mixture indicates the amount of cm3 of k/10 solution of bichromate that went to oxidation of fatty acids and cholesterol.- Example. In titration in the blank test, 33.0 cm3 were used, with the test sample - 23.45 cm3 of and/10 solution of hyposulfite, which corresponds to 9.55 cm3 of n/10 solution of bichromate or ' =2.65 mg of oleic acid. - For determination of cholesterol, another 10 cm3 of extract (E. 1) are evaporated as described above. To dissolve the residue, add chloroform in small portions, slightly warm and decant into a 10 cm3 measuring cylinder. After repeating the extraction 3 times, make up to 5 cm3 with chloroform, add 1 cm3 of acetic anhydride and 0.1 cm3 of concentrated H2SO4. At the same time, in the same way, treat a standard solution containing 0.5 mg of cholesterol in 5 cm3 of chloroform. Mix the solutions, leave in the dark for 15 min and then colorimetrically determine.- Calculation: the obtained amount in mg of cholesterol, multiplied by 3.92, is subtracted from the amount of cm3 of bichromate that went to oxidation of the total amount of fat and cholesterol; the difference is divided by 3.60 (3.92 is the number of cm3 of n/10 solution of chromic acid oxidizing 1 mg of cholesterol; 3.60 is the average of 3.59 and 3.61, i.e. the numbers characterizing the reducing capacity of palmitic and oleic acids). Determination of phosphatides (lecithin and cephalin, according to Bloor). Principle: lipoids, isolated by precipitation of alcohol extract of blood with acetone and magnesium chloride, are oxidized by chromic acid. 1 mg of lecithin is oxidized by 3.11 cm3 of and/10 solution of chromic acid, 1 mg of cephalin-3.12 cm3; other lipoids have a slightly different reducing capacity, which gives Bloor the right to take for all lipoids a factor equal to 3 cm3 of and/10 solution of bichromate for 1 mg of phosphalipoid.'-In a 100 cm3 volumetric flask containing 75 cm3 of distilled 95% alcohol, with constant stirring, add 5 cm3 of B.; heat on a water bath to boiling, boil for 5 min; after cooling, make up to the mark with alcohol and filter through a defatted filter; 20 cm3 of the filtrate are evaporated to dryness, the residue is extracted by boiling with small portions of petroleum ether, which is poured into a graduated centrifuge tube of 15 cm3 capacity. When the volume of the extract becomes 10 cm3, it is centrifuged, the clear supernatant is poured into another graduated centrifuge tube, it is immersed in warm water and the petroleum ether is carefully evaporated, bringing the volume of the extract to 2 cm3. Add 7 cm3 of distilled acetone, 3 drops of a saturated cold alcoholic solution of MgCl2; mix, centrifuge, pour off the clear liquid, and, washing the precipitate with acetone, dissolve it in 5 cm3 of wet ether, free from peroxides. The clear ether extract, quantitatively collected in an oxidation flask, is evaporated, and the residues of ether are removed by suction of air. Adding to the flask 5 cm3 of silver solution (5) and 3 cm3 of n solution of potassium bichromate (2), carry out oxidation and subsequent titration as described above (determination of fat and cholesterol).
The amount of phosphatides in the portion of extract taken for analysis is equal to -^- mg, where a is the number of cm3 of w/10 solution of hyposulfite used in titrating the test sample, b is the number of cm3 of и/10 solution of hyposulfite used in titrating in a blank test, and 3 is the number of cm3 of ni10 solution of bichromate required to oxidize 1 mg of phosphatides. - For the determination of phosphorus in lipoids, according to Blau, to the residue after evaporating the alcohol-ether extract of blood taken in an amount of 5 cm3, add 0.5 cm3 of a mixture of concentrated sulfuric and nitric acids (1:1) and heat until a colorless transparent solution is obtained. After diluting with water, neutralizing with alkali, and bringing to volume with water to 5 cm3, determine phosphorus in the resulting liquid colorimetrically (see below, phosphorus of blood). Lecithin contains about 4% phosphorus. - Determination of cholesterol, according to S. Gjerogi (Szent-Gyorgyi). The method is based on the precipitation of free cholesterol by digitonin and on weighing the resulting precipitate. In the extract of B. (corresponding to 1 cm3), cholesterol is precipitated by adding 1 cm3 of digitonin solution (1 g of crystalline digitonin in 50 cm3 of 80% alcohol). The resulting mixture is evaporated in a water bath to half its volume, allowed to stand at room temperature, and after 1/4 hour is filtered under pressure through an asbestos filter. With the aid of 7 cm3 of 80% acetone, the precipitate is washed into a centrifuge tube, which is immersed in a water bath (temperature 45-50°), the contents are stirred with a glass rod, and after 5 min. it is centrifuged. After suctioning off the liquid through an asbestos filter [Fig. 14 (pp. 675-676)], the precipitate is first washed with 80% acetone, then with pure acetone. After shaking the precipitate in water (temperature 50°), it is completely transferred to the same filter, the water is suctioned off, the precipitate on the filter is dried and weighed. To calculate the amount of cholesterol, the weight of the precipitate found is multiplied by 0.2431 (Windaus). Mineral substances of B. Heubner gives the following table of the content of mineral substances in the normal plasma of human blood. Mineral substances Cl. HCO3 SO4. HPO4 Fluctuations (in mg%) I Concentration in average equivalents limiting 320-400 3--15 355 160 22 10 Na........!
- 300 20 10 2,5 879,5 0,100 0,026 0,005 0,002 0,130 0,005 0,005 0,002 0,133 K-T 0,142 bases In various animal species, as well as in different parts of Blood (plasma, serum and blood corpuscles), the content of mineral substances is not the same. These differences can be significant, as can be seen from the analyses of Abderhalden. 1,000 weight parts of whole Blood contain: Elements Horse Pig Rabbit Cow Bull Sheep Goat Na . . . . ! 2,691 2,406 2,78 3,635 3,712 3,638 3,579 2,738 2,309 2,108 0,407 0,407 0,405 0,396 Ca . . . . ; 0,051 0,068 0,072 0,069 0,064 0,07 0,066 Mg . . . | 0,064 0,088 0,057 0,035 0,036 0,033 0,04 Cl.....! 2,785 2,69 2,898 3,079 3,081 3,08 2,92 Inorg. P . ' 0,806 0,749 0,685 0,171 0,174 0,19 0Д42 Water . . . 749,02 790,56 816,92 808,9 814,8 821,67 803,89 1,000 weight parts of serum contain: Elements I Horse ; Pig Na Ca Mg Cl Inorg. Water . . 4,34 0,263 0,111 0,045 3,726 0,071 902,05- 4,251 0,27 0,122 0,041 3,627 0,052 917,6 Rabbit 4,442 0,259 0,116 0,046 3,883 0,064 925,6 Cow 4,312 6,255 0,119 0,044 3,69 0,084 913,64 Bull 4,316 0,262 0,111 0,042 3,688 0,062 913,38 Sheep 4,303 0,256 0,117 0,041 3,711 0,073 917,4 Goat 4,326 0,246 0,121 0,041 3,691 0,07 907,69 Goat : Dog Cat 3,675 ! 3,686 0,25 0,26 0,062 ! 0.053 0,052 1 0,059 2,93 1 2,815 0,57 ! 0,55 810,0 795,5 Dog 4,63 0,226 0,113 0,04 4,02 0,08 923,98 Cat 4,43 0,262 0,04 4,17 0,07 926,93 1,000 weight parts of blood corpuscles contain: Elements . Horse Pig \ Rabbit , Cow Bull Sheep Goat Dog Cat Na . . . K . . . Ca . . . Mg . . . Cl . . . Inorg. P. . . Water . . 0,08 1.94 1,45 613,15 0,15 1,47 1,65 625,61 0,077 1,236 1,73 633,53 2,23 0,72 0,017 1,81 0,35 591,85 Mineral substances in the blood are for the most part in the state of true solution, while partly they form compounds with colloids. Adsorption by colloids of both individual ions and salt molecules is also possible. When calculating the sum of acids and bases in Blood, the latter are found to predominate (see above). The degree of ionization of individual salts depends on the ratio of ions present in Blood. The significance of electrolytes in Blood is determined by the following basic functions: 1) maintaining the osmotic concentration of Blood at a constant level; 2) maintaining the active reaction of Blood at a constant level; 3) affecting metabolism in cells; 4) influencing the state of colloids (see Ions, physiological action).-For the life of the organism, not only the presence of certain mineral substances in Blood is important, but also their specific quantitative ratio of ions. Thus, for example, according to the data of Gollwitzer-Meier, for the excitability of the respiratory center, the ratio in Blood of ions [K+].[H2PO4-]-[Ca++].[Mg++] is important. At the present time, many methods have been proposed for determining the content of electrolytes both in whole Blood and in plasma and serum. When applying the method, it must be taken into account that 1) in ash analyses, all compounds of the component being studied are determined, both those bound to organic substances and those present in Blood in the form of mineral compounds; 2) in serum analyses, part of Ca, Mg and HPO4 may precipitate with fibrin during clotting; and 3) when studying the distribution of mineral substances between plasma and formed elements, attention should be paid to ensuring that the active reaction of the blood and its CO2 content do not change during blood collection and preservation until analysis; otherwise, a change in the distribution of ions between plasma and blood corpuscles may occur. Determination of the total amount of bases in serum is usually performed by the electrodialysis method (see Dialysis). Determination of the dialyzable part of Blood, Na, Ca, Cl, etc., by the compensatory dialysis method (Rona). In a serum sample, the total amount of the substance whose dialyzable part is to be determined is determined. In a number of other samples, a larger amount of serum is dialyzed against the smallest possible amount of a solution of the salt of the electrolyte being studied, and this external solution is made isotonic with the serum by adding other compounds not included in the study. The concentration of the salt of the substance being studied varies in different parallel experiments, so that it is sometimes higher and sometimes lower than in the serum. After a certain time, for example, after 24 hours, equilibrium occurs between the external and internal fluids; dialysis is stopped, and the concentration of the substance being studied is determined in the individual samples of external fluid. In one of the series of samples, the concentration does not change; therefore, it is equal to the concentration of the dialyzable part of the substance being studied in the serum being analyzed. Calcium is present in plasma partly in the form of free ions, partly in the form of undissociated salt Ca(HCO3)2 and partly in combination with colloids. By the compensatory dialysis method of Rona and Takahashi, it was established that the amount of free calcium ions is 3 mg%, calcium of organic compounds is 25-30% of the remaining amount of calcium, and 65-75% falls to the share of undissociated salt. Different blood proteins have different abilities (at the same pH) to bind calcium; 100 g of fibrin can bind 11.5 mg of calcium, 37.0 of globulin, and 78.0 of albumin. The proteins of plasma can bind in total 1/3 of the total amount of calcium.-The physiologically active part of calcium is considered to be its ionized form. For calcium ions, as well as for hydrogen ions, there exists a buffer system in the body. According to Rona et al., a decrease in the concentration of hydrogen ions and an increase in the concentration of bicarbonate (HCO3') and phosphate (HPO4-) ions leads to a decrease in the concentration of calcium ions (Ca++); opposite changes cause an increase. --The calcium content in human blood is 10-12 mg%. In blood corpuscles, the calcium content is negligible (in dogs 2.5-3.0 mg% CaO) (Heubner). Accordingly, in whole Blood, there is less calcium than in plasma and serum. In humans, the content of Ca in whole blood varies from 5.3 to 8.9 mg%, in serum from 9 to 13 mg%. The amount of calcium in blood undergoes fluctuations during the year, with the lowest values observed in January and September, and the highest in May and November. Venous blood, as a rule, contains somewhat more Ca than arterial blood. Under normal conditions, the Ca content in Blood is quite constant, and various effects on calcium metabolism in a healthy organism change the Ca content in Blood only slightly and for only a short time. The introduction of Ca per os in small doses does not affect the concentration of Ca in Blood; large doses (up to 20 g) give a significant increase. Bloodletting up to x/6 of the total amount of blood can cause an increase in Ca in Blood during the first hour, while during the second and third hour only slight fluctuations compared to the initial concentration.
S. Severin. On the specific action of the Ca ion - see Calcium. Tetany and spasmophilia have long been associated with disturbances in calcium metabolism, with hypocalcemia observed in both infantile tetany (3.5-7 mg%) and in adult tetany, even during the latent period. There appears to be a relationship between the deficiency of calcium in the blood and the increased excitability of the neuromuscular system observed in tetany. Similarly, the removal of the parathyroid glands in animals leads to the development of tetany and a decrease in the calcium content of the blood (McCallum, Voegtlin). In contrast to rickets (see below), in tetany there are normal phosphorus levels in the blood. Despite the fact that in rickets there is a strong depletion of calcium from bones, almost normal amounts of Ca or values at the lower limit of normal are found in the serum. With relatively normal amounts of calcium, the amount of inorganic phosphorus in rickets is reduced (Howland, Kramer); the authors attach great importance to the ratio between Ca and PO4. The calcium content in the blood in tbc has been the subject of study by many authors; most believe that the amount of calcium in the blood remains within normal limits, while Bergheim asserts that in tbc there is demineralization, which is also expressed in a decrease in calcium in the blood. In nephritis, the amount of calcium can significantly decrease, especially in cases of nephritis accompanied by signs of uremia, whereas in hypertension without renal symptoms, the amount of calcium was mostly found to be normal. In eclampsia, the calcium content in the blood is mostly decreased; some authors view hypocalcemia as an etiological factor causing the development of eclampsia. In major bone fractures, a slight increase in calcium in the blood is observed with a simultaneous more significant increase in inorganic phosphorus (see also Metabolism, mineral). Methods of determination. Determination by de Waard. In the case of research on whole blood, proteins are precipitated or the blood is ashed beforehand; serum does not need to be burned. From ash solutions after burning or from the filtrate after protein precipitation or from serum, calcium is precipitated with a saturated solution of ammonium oxalate (C2O4+Ca = CaC2O4). The precipitate of calcium oxalate, washed with water, is dissolved in strong HNO3 and the oxalic acid liberated is titrated with a solution of potassium permanganate: 5H2C2O4 + 2KMnO4 + 6HNO3 = 2KNO3 + 2Mn(NO3)2 + 8H2O + 10CO2. Determination in serum. 0.5 or 1 cm3 is introduced into a centrifuge tube and 0.5 cm3 of a saturated solution of ammonium oxalate is added. It is left to stand for 30 minutes, after which it is centrifuged. The liquid is carefully decanted as completely as possible. It is best to do this using the device shown in Fig. 15 (pp. 675-676). Air is blown into a short tube, the liquid rises through another tube which serves as a siphon. The lower end of the long tube with a very narrow bore is bent into a hook so that the precipitate is not sucked into the tube. After this, 2-3 cm3 of water is added, the precipitate is shaken, and it is centrifuged again. After repeating the washing 2-3 times, 0.3 cm3 of strong HNO3 is added to the precipitate, it is heated in a water bath to 50-70°, and after the precipitate has dissolved, it is titrated from a microburette with n/60 KMnO4 until a pale pink color appears that persists for 2 minutes. Determination in whole blood. 0.5-1.5 cm3 of blood is placed in a platinum crucible and first dried on a weak flame, then burned on a strong flame until complete ashing, the ash is dissolved in a few drops of dilute hydrochloric acid (no more than 1 cm3), the solution is quantitatively transferred (repeatedly rinsing the crucible with small portions of water) to a centrifuge tube. To the resulting CaCl2 solution, 0.5 cm3 of a saturated solution of (NH4)2C2O4 is added, it is placed in a boiling water bath, a few drops of concentrated NH4 are added, and it is carefully acidified with glacial acetic acid. The mixture is cooled and after 15-30 minutes it is centrifuged. The liquid is carefully decanted and the determination is carried out further as described for the analysis of Ca in serum. When determining calcium, distilled water must be redistilled twice. The determination should be performed in tubes of Jena glass. Calculation. From the amount of cm3 of n/60 KMnO4 used for titration, subtract 0.01 cm3 or 0.02 cm3 - the amount required to obtain a noticeably pink color in a blank experiment - 1 cm3 of the solution of KMnO4 corresponds to 0.4 mg Ca. The result obtained, relating to the amount of blood or serum taken, should be reduced to 100 cm3. Determination by the Kramer-Tisdal method - see Calcium.
* «93 Potassium. The larger part of potassium, which completely passes through the ultrafilter, is in the blood in a dissociated state. Rona and Petow showed that potassium does not combine with serum colloids. The potassium content in human serum is fairly constant in different individuals and amounts to 16-24 mg%, in whole blood - 150-200 mg%. According to Zondek, the potassium content in blood is related to the activity of the autonomic nervous system. Thus, in vagotonics, lower values for potassium were found than in sympathicotonic individuals. However, numerous literary data on this question are by no means uniform. An increase in potassium in blood is observed in renal insufficiency, in essential hypertension, asthma, and diseases of the circulatory apparatus with a pronounced insufficiency. Byzlov notes a sharp increase in potassium in the blood of scarlatinal patients. The potassium content in blood depends to a large extent on the number of erythrocytes; therefore, in both primary and secondary anemias, its amount was found to be significantly reduced. In general, in various pathological conditions, relatively few changes in potassium content were observed. More importance was attached to the ratio between potassium and calcium. Kylin and Myhrman found the value of the coefficient -^"iirit PRI эссеш1Иальной hypertension to be 2.08-2.97, whereas in normal conditions the fluctuations lie between 1.70 and 2Д5. (See also Metabolism, mineral.) Determination by Kramer and Tisdall. The method is based on the precipitation of potassium with cobalt nitrite in the form of a complex salt K3Na[Co(N02)6] · 6H2O and subsequent oxidimetric titration of the precipitate with a solution of potassium permanganate.- Treatment of B. or serum is freed from proteins by the addition of trichloroacetic acid or by ashing. In a measuring flask with a capacity of 50 cm3, containing about 25 cm3 of doubly distilled water, add a precisely measured amount of blood (5-10 cm3) and 2-3 drops of octyl alcohol (to prevent foaming). To the hemolyzed blood, slowly with constant shaking, add 12-13 cm3 of 12% trichloroacetic acid. After about 10 minutes, bring to the mark and filter. Take a certain measured portion of the resulting filtrate, dry it in a crucible to dryness, extract the residue with a 1/10 solution of HCl and bring the volume to 10 cm3.- The ash of 2-3 cm3 of serum or blood is repeatedly extracted with small portions of twice distilled water with stirring with a rod; the aqueous extracts are successively filtered through a small ashless filter into a measuring flask with a capacity of 5-10 cm3 and brought to the mark. Only alkaline salts pass into the aqueous extract. One can (less conveniently) carry out the determination directly in the serum or filtrate after precipitation of proteins without subjecting them to ashing. In the following, the determination of potassium is carried out in a certain portion of the contents of the flask.-Reagents. 1) 25 g of crystalline cobalt nitrate are dissolved in 50 cm3 of water and 12.5 cm3 of glacial acetic acid are added to the solution; 2) 120 g of NaN02, free from potassium, are dissolved in 180 cm3 of water; 3) to the entire amount of solution (1) add 210 cm3 of solution (2) and through the mixture air is drawn until the colored vapors with the characteristic odor of nitrogen oxides are removed. The reagent is kept cold (not more than a month), before use it is filtered. 4) Approximately 4n solution of H2S04; 5) w/100 solution of Na2C2O4; 6) n/10 solution of KMnO4; 7) 50% solution of NaNO2. Procedure of determination. In a centrifuge tube, to 1 cm3 of liquid obtained after treatment of blood or serum or plasma, add 0.5 cm3 of water and 0.5 cm3 of NaN02 solution (7); after mixing, first add 2 cm3 of water, then 2 cm3 of cobalt solution (3) drop by drop, mix well and after 45 min. centrifuge. The liquid is carefully decanted, 5 cm3 of water are added along the wall of the tube, mixed with the remaining liquid above the precipitate without shaking the latter, and centrifuged again. Washing with 5 cm3 of water and centrifugation is repeated 3-4 times. Then 2 cm3 of KMnO4 solution (6) and 1 cm3 of H2S04 solution (4) are added to the precipitate, mixed with a rod and heated in a boiling water bath for 1-11/2 min.; the pink color should still be preserved (if a brownish tint appears with prolonged heating, the analysis is spoiled). To the warm solution, 2-3 cm3 of Na2C2O4 solution (5) are added and the excess is titrated with KMnO4 solution (6) until a faint pink color appears.-Calculation. 1 cm3 of n/10 solution of KMnO4 = 0.071 mg K. From the amount of n/10 KMnO4 solution used, subtract 0.03 cm3, required to give a faint pink color to the same volume of pure water as the volume of liquid during titration; multiply the difference by 2 (to convert the number of cm3 of n/10 solution into the number of cm3 of n/100 solution), subtract the number of cm3 of n/10 solution of Na2C2O4 used, and multiply the resulting difference by 0.071. The result found is recalculated per 100 cm3 of blood. Sodium. In the total concentration of blood cations, 90% is accounted for by sodium, the larger part of which is in combination with Cl. The NaCl content in human blood is from 560 to 600 mg%. Blood corpuscles contain 50-60% of the plasma's NaCl. Since the Cl content in human blood is about 350 mg%, the equivalent amount of Na in blood should be about 230 mg%; the Na content in blood is on average 330-340 mg%. Consequently, a small part of Na is in blood in other compounds, mainly in the form of NaHC03 and probably partly in combination with proteins. Changes in Na content in blood were observed relatively little. A decrease in Na in blood is noted on a vegetable diet. Colorimetric determination of sodium by Barrensen and Messine's method. Sodium is precipitated in the form of a complex salt: uranyl acetate, zinc and sodium [(U02)3 ZnNa (CH3COO)9·9H2O]. For the colorimetric determination of sodium, the reaction of uranyl with potassium ferrocyanide is used: K4Fe(CN)6 + (U02) (CH3COO)2 = (U02) K2Fe(CN)6 + 2CH3COOK. A stable reddish-brown color is obtained. Simultaneously with the test solution, the same reaction is carried out with a standard solution.-Solutions: 1) 10 g of uranyl acetate and 6 g of 30% acetic acid are dissolved with heating in 50 cm3 of distilled water; 2) 30 g of zinc acetate and 3 g of 30% acetic acid are dissolved with heating in 50 cm3 of water; 3) both solutions are mixed warm and filtered after a day; 4) standard NaCl solution (0.254 g of chemically pure calcined NaCl is dissolved in water, 1 cm3 of chloroform is added and brought to 1,000 cm3 with water in a measuring flask; 1 cm3 of solution = 0.1 mg Na); 5) saturated solution of zinc acetate in alcohol; 6) 20% solution of potassium ferrocyanide.-Procedure of determination. In a graduated centrifuge tube of Jena glass, 0.9 cm3 of distilled water is introduced and 0.1 cm3 of blood is added; the pipette is rinsed several times with the resulting solution. To precipitate protein and inorganic phosphorus, which interfere with the determination, 3 cm3 of the saturated alcoholic solution of zinc acetate (5) are added, left to stand for 1-2 min. in a beaker with hot water. After cooling, if evaporation has occurred, add 96% alcohol to the original volume and centrifuge or filter through a dry filter. Now the resulting filtrate and the standard sodium chloride solution are treated simultaneously; 2 cm3 of filtrate (= 0.05 cm3 of blood) and 1 cm3 of standard solution are placed in two different centrifuge tubes of thick Jena glass. To the standard, add 3 cm3 of 96% alcohol. To both tubes add 2 cm3 of zinc uranyl acetate solution (3) and by adding 96% alcohol (approx. 1.2 cm3) bring the alcohol concentration in the test tube to 50%. Leave to stand for 30 min., centrifuge, suck off the alcohol as completely as possible (as described above in the determination of Ca) and add 3 cm3 of 50% alcohol, thoroughly washing the walls of the tubes. This washing is repeated 3 times. To the yellow precipitate add 0.5 cm3 of diluted acetic acid and a little water.
The solutions are quantitatively transferred to 50 cm3 volumetric flasks and made up to the mark with water. Add 0.5 cm3 of a 20% solution of potassium ferrocyanide, mix thoroughly, and after 3 minutes, perform colorimetry. --The calculation is performed using the formula -~2 200 mз %, where H2 is the height of the column in the standard -"1 solution, H1 is in the analyzed solution. Magnesium. The magnesium content in human blood serum is 1.6-3.5 mg%. In contrast to Na and K, divalent magnesium is present in the blood only partly in the form of easily dissociating salts. Cushny found in the ultrafiltrate of cow blood serum only half of the total amount of Mg. The non-filterable part is probably mainly in combination with proteins. The action of magnesium is in general similar to that of calcium; but in contrast to calcium, it has the special property of acting depressingly on the nerve apparatus of skeletal muscle. Determination by Gadiet's method. From the serum, after removing calcium, magnesium is precipitated as ammonium magnesium phosphate. In the precipitate, phosphorus is determined colorimetrically, from the amount of which Mg is calculated. --Method of determination. To precipitate calcium in a centrifuge tube, introduce 2 cm3 of plasma or serum, add 3 cm3 distilled water, 1 cm3 of a 3% solution of ammonium oxalate. After 30 min., centrifuge, 5 cm3 of completely transparent centrifugate (=1.6 cm3 of plasma) are introduced into a centrifuge tube, add 1 cm3 of a 2% solution of ammonium phosphate, 2 cm3 of a 20% solution of ammonia, mix thoroughly with a glass rod, place for 5 min. in a water bath at 80° and leave covered for a day; centrifuge, decant the transparent liquid as much as possible (as when determining Ca in K.), add 2 cm3 of a 2% solution of ammonia, centrifuge and repeat this washing 2 more times. Dissolve the precipitate in 0.5 cm3 of normal H2SO4 solution with heating. The resulting solution is poured into a 25 cm3 measuring flask, brought to the mark with water and the amount of phosphorus is determined colorimetrically. When calculating, the found amount of phosphorus should be multiplied by --- = 0.784, in order to obtain the amount of Mg. Chlorine (Cl) in plasma is entirely in an ionized state; however, this does not exclude the possibility that a small part of the Cl ions is adsorbed by protein bodies. According to Hamburger and Nasse, Cl ions, due to the complete permeability of blood corpuscles for them, can move from the plasma into the corpuscles and vice versa, thereby changing the Cl content in the plasma. An increase in CO2 tension in K. causes the transition of Cl ions from the plasma into erythrocytes, and a decrease in CO2 tension—the reverse process. Thus, Cl ions to some degree regulate the alkalinity of K., freeing or binding plasma bases. Quantitatively, Cl in K. significantly exceeds all other anions. Snapper gives for serum 360-380 mg% and for erythrocytes 130-160 mg%, and he assumes that the chlorine content in serum and erythrocytes is almost the same, if only the intraglobular fluid is taken into account without the erythrocyte stroma. Arterial plasma always contains more Cl than venous plasma (according to Brunetti, by 12 mg%). Many researchers note fluctuations in the Cl content in plasma after food intake. During muscular work, changes in the Cl content in K. are inconsistent. The determination of chlorides in K. has no special clinical significance, since their accumulation in the blood usually does not occur, because when chlorides are retained in the body, they pass into the tissues along with water. Most often, fluctuations in the Cl content in K. should rather be attributed to thickening or thinning of K., rather than to true hyper- or hypochloremia. Ambard proposed a coefficient indicating the ratio between the amount of chlorides in urine and in blood; but this coefficient has not received practical significance. In nephroses (with edema), the amount of sodium chloride in K. is sometimes decreased, whereas in interstitial glomerulonephritis it may be increased. The amount of chlorides is decreased in diabetes (mellitus and insipidus), fever, pneumonia (before the crisis, however, the amount of chlorides is increased); it is also decreased in anemia. At the height of digestion, a decrease in chlorides in the blood is observed; at the same time, an increase in the amount of bicarbonates in K. is noted (see also Mineral metabolism). Determination of chlorides by Prikladovitsky and Apollonov. --Reagents: 1) n/10 solution of NaCl (0.5846 g of chemically pure dry NaCl is dissolved in 1 liter of doubly distilled water); 2) П/10 solution of AgNO3; the titer is established against П/100 solution of NaCl (1) with K2CrO4 indicator; 3) П/10 solution of KJ + J2: in 20 cm3 of water dissolve 0.83 g of KJ, add 0.2 g of iodine and add water to 500 cm3; the titer is established before each titration against AgNO3 (2): 2 cm3 of П/100 solution of AgNO3, 0.05 cm3 of HNO3(1:3), 3-5 cm3 of water, 3-4 drops of aqueous starch solution are introduced into a flask and titrated with iodine solution (3) to a weak blue coloration; 4) nitric acid in dilution 1:3; 5) saturated solution of KMnO4; 6) glucose solution; 7) aqueous starch solution. --Method of determination. In an Erlenmeyer flask with a capacity of 25-35 cm3, place 2-3 cm3 of water and 0.1 cm3 of K. or plasma. The pipette is rinsed several times with the liquid in the flask. Add 2 cm3 (for K.) or 1 cm3 (for plasma) of HNO3 solution (4), 2 cm3 of П/100 solution of AgNO3 (2), heat on a sand bath to boiling, add 15-20 drops of saturated KMnO4 solution and boil for 10-12 min. After boiling, add, while shaking, dropwise a glucose solution until decolorization. After cooling, the contents of the flask are filtered, rinsing the flask and washing the filter 3 times with water (3 cm3). To the completely transparent filtrate, add 3-4 drops of starch solution and titrate the excess AgNO3 with iodine solution (3) until the appearance of a weak blue coloration. --Calculation: the amount of Cl in mg% = [A-(B-0.01)]355, where A is the amount of cm3 of AgNO3 solution added, B is the amount of cm3 of iodine solution used for back-titrating the excess AgNO3, 0.01 cm3 is the correction for coloration. Bicarbonate ion HCO3-. The average content in plasma and venous blood is 0.15% HCO3-; in normal conditions, its amount is subject to significant fluctuations depending on the CO2 content in K. (see Buffer properties of blood) and is significantly decreased in acidosis. Phosphorus in K. is present both in the liquid part and in the formed elements. The formed elements are richest in phosphorus. Abderhalden proposed to distinguish three fractions of phosphorus in K.: 1) phosphorus of lipoids, 2) phosphorus of proteins, and 3) inorganic phosphorus. Grünwald also distinguishes acid-soluble phosphorus, which he understands as the phosphorus of those compounds that pass into solution during protein precipitation <i97 П o л Normal P content in mg% in humans Total amount Acid-soluble Inorganic Lipoid Residual Male Female Male Female Plasma 7.7-13.8
The solutions are quantitatively transferred to 50 cm3 volumetric flasks and made up to the mark with water. Add 0.5 cm3 of a 20% solution of potassium ferrocyanide, mix thoroughly, and after 3 minutes, perform colorimetry. --The calculation is performed using the formula -~2 200 mз %, where H2 is the height of the column in the standard -"1 solution, H1 is in the analyzed solution. Magnesium. The magnesium content in human blood serum is 1.6-3.5 mg%. In contrast to Na and K, divalent magnesium is present in the blood only partly in the form of easily dissociating salts. Cushny found in the ultrafiltrate of cow blood serum only half of the total amount of Mg. The non-filterable part is probably mainly in combination with proteins. The action of magnesium is in general similar to that of calcium; but in contrast to calcium, it has the special property of acting depressingly on the nerve apparatus of skeletal muscle. Determination by Gadiet's method. From the serum, after removing calcium, magnesium is precipitated as ammonium magnesium phosphate. In the precipitate, phosphorus is determined colorimetrically, from the amount of which Mg is calculated. --Method of determination. To precipitate calcium in a centrifuge tube, introduce 2 cm3 of plasma or serum, add 3 cm3 distilled water, 1 cm3 of a 3% solution of ammonium oxalate. After 30 min., centrifuge, 5 cm3 of completely transparent centrifugate (=1.6 cm3 of plasma) are introduced into a centrifuge tube, add 1 cm3 of a 2% solution of ammonium phosphate, 2 cm3 of a 20% solution of ammonia, mix thoroughly with a glass rod, place for 5 min. in a water bath at 80° and leave covered for a day; centrifuge, decant the transparent liquid as much as possible (as when determining Ca in K.), add 2 cm3 of a 2% solution of ammonia, centrifuge and repeat this washing 2 more times. Dissolve the precipitate in 0.5 cm3 of normal H2SO4 solution with heating. The resulting solution is poured into a 25 cm3 measuring flask, brought to the mark with water and the amount of phosphorus is determined colorimetrically. When calculating, the found amount of phosphorus should be multiplied by --- = 0.784, in order to obtain the amount of Mg. Chlorine (Cl) in plasma is entirely in an ionized state; however, this does not exclude the possibility that a small part of the Cl ions is adsorbed by protein bodies. According to Hamburger and Nasse, Cl ions, due to the complete permeability of blood corpuscles for them, can move from the plasma into the corpuscles and vice versa, thereby changing the Cl content in the plasma. An increase in CO2 tension in K. causes the transition of Cl ions from the plasma into erythrocytes, and a decrease in CO2 tension—the reverse process. Thus, Cl ions to some degree regulate the alkalinity of K., freeing or binding plasma bases. Quantitatively, Cl in K. significantly exceeds all other anions. Snapper gives for serum 360-380 mg% and for erythrocytes 130-160 mg%, and he assumes that the chlorine content in serum and erythrocytes is almost the same, if only the intraglobular fluid is taken into account without the erythrocyte stroma. Arterial plasma always contains more Cl than venous plasma (according to Brunetti, by 12 mg%). Many researchers note fluctuations in the Cl content in plasma after food intake. During muscular work, changes in the Cl content in K. are inconsistent. The determination of chlorides in K. has no special clinical significance, since their accumulation in the blood usually does not occur, because when chlorides are retained in the body, they pass into the tissues along with water. Most often, fluctuations in the Cl content in K. should rather be attributed to thickening or thinning of K., rather than to true hyper- or hypochloremia. Ambard proposed a coefficient indicating the ratio between the amount of chlorides in urine and in blood; but this coefficient has not received practical significance. In nephroses (with edema), the amount of sodium chloride in K. is sometimes decreased, whereas in interstitial glomerulonephritis it may be increased. The amount of chlorides is decreased in diabetes (mellitus and insipidus), fever, pneumonia (before the crisis, however, the amount of chlorides is increased); it is also decreased in anemia. At the height of digestion, a decrease in chlorides in the blood is observed; at the same time, an increase in the amount of bicarbonates in K. is noted (see also Mineral metabolism). Determination of chlorides by Prikladovitsky and Apollonov. --Reagents: 1) n/10 solution of NaCl (0.5846 g of chemically pure dry NaCl is dissolved in 1 liter of doubly distilled water); 2) П/10 solution of AgNO3; the titer is established against П/100 solution of NaCl (1) with K2CrO4 indicator; 3) П/10 solution of KJ + J2: in 20 cm3 of water dissolve 0.83 g of KJ, add 0.2 g of iodine and add water to 500 cm3; the titer is established before each titration against AgNO3 (2): 2 cm3 of П/100 solution of AgNO3, 0.05 cm3 of HNO3(1:3), 3-5 cm3 of water, 3-4 drops of aqueous starch solution are introduced into a flask and titrated with iodine solution (3) to a weak blue coloration; 4) nitric acid in dilution 1:3; 5) saturated solution of KMnO4; 6) glucose solution; 7) aqueous starch solution. --Method of determination. In an Erlenmeyer flask with a capacity of 25-35 cm3, place 2-3 cm3 of water and 0.1 cm3 of K. or plasma. The pipette is rinsed several times with the liquid in the flask. Add 2 cm3 (for K.) or 1 cm3 (for plasma) of HNO3 solution (4), 2 cm3 of П/100 solution of AgNO3 (2), heat on a sand bath to boiling, add 15-20 drops of saturated KMnO4 solution and boil for 10-12 min. After boiling, add, while shaking, dropwise a glucose solution until decolorization. After cooling, the contents of the flask are filtered, rinsing the flask and washing the filter 3 times with water (3 cm3). To the completely transparent filtrate, add 3-4 drops of starch solution and titrate the excess AgNO3 with iodine solution (3) until the appearance of a weak blue coloration. --Calculation: the amount of Cl in mg% = [A-(B-0.01)]355, where A is the amount of cm3 of AgNO3 solution added, B is the amount of cm3 of iodine solution used for back-titrating the excess AgNO3, 0.01 cm3 is the correction for coloration. Bicarbonate ion HCO3-. The average content in plasma and venous blood is 0.15% HCO3-; in normal conditions, its amount is subject to significant fluctuations depending on the CO2 content in K. (see Buffer properties of blood) and is significantly decreased in acidosis. Phosphorus in K. is present both in the liquid part and in the formed elements. The formed elements are richest in phosphorus. Abderhalden proposed to distinguish three fractions of phosphorus in K.: 1) phosphorus of lipoids, 2) phosphorus of proteins, and 3) inorganic phosphorus. Grünwald also distinguishes acid-soluble phosphorus, which he understands as the phosphorus of those compounds that pass into solution during protein precipitation <i97 П o л Normal P content in mg% in humans Total amount Acid-soluble Inorganic Lipoid Residual Male Female Male Female Plasma 7.7-13.8
The solutions are quantitatively transferred to 50 cm3 volumetric flasks and made up to the mark with water. Add 0.5 cm3 of a 20% solution of potassium ferrocyanide, mix thoroughly, and after 3 minutes, perform colorimetry. --The calculation is performed using the formula -~2 200 mз %, where H2 is the height of the column in the standard -"1 solution, H1 is in the analyzed solution. Magnesium. The magnesium content in human blood serum is 1.6-3.5 mg%. In contrast to Na and K, divalent magnesium is present in the blood only partly in the form of easily dissociating salts. Cushny found in the ultrafiltrate of cow blood serum only half of the total amount of Mg. The non-filterable part is probably mainly in combination with proteins. The action of magnesium is in general similar to that of calcium; but in contrast to calcium, it has the special property of acting depressingly on the nerve apparatus of skeletal muscle. Determination by Gadiet's method. From the serum, after removing calcium, magnesium is precipitated as ammonium magnesium phosphate. In the precipitate, phosphorus is determined colorimetrically, from the amount of which Mg is calculated. --Method of determination. To precipitate calcium in a centrifuge tube, introduce 2 cm3 of plasma or serum, add 3 cm3 distilled water, 1 cm3 of a 3% solution of ammonium oxalate. After 30 min., centrifuge, 5 cm3 of completely transparent centrifugate (=1.6 cm3 of plasma) are introduced into a centrifuge tube, add 1 cm3 of a 2% solution of ammonium phosphate, 2 cm3 of a 20% solution of ammonia, mix thoroughly with a glass rod, place for 5 min. in a water bath at 80° and leave covered for a day; centrifuge, decant the transparent liquid as much as possible (as when determining Ca in K.), add 2 cm3 of a 2% solution of ammonia, centrifuge and repeat this washing 2 more times. Dissolve the precipitate in 0.5 cm3 of normal H2SO4 solution with heating. The resulting solution is poured into a 25 cm3 measuring flask, brought to the mark with water and the amount of phosphorus is determined colorimetrically. When calculating, the found amount of phosphorus should be multiplied by --- = 0.784, in order to obtain the amount of Mg. Chlorine (Cl) in plasma is entirely in an ionized state; however, this does not exclude the possibility that a small part of the Cl ions is adsorbed by protein bodies. According to Hamburger and Nasse, Cl ions, due to the complete permeability of blood corpuscles for them, can move from the plasma into the corpuscles and vice versa, thereby changing the Cl content in the plasma. An increase in CO2 tension in K. causes the transition of Cl ions from the plasma into erythrocytes, and a decrease in CO2 tension—the reverse process. Thus, Cl ions to some degree regulate the alkalinity of K., freeing or binding plasma bases. Quantitatively, Cl in K. significantly exceeds all other anions. Snapper gives for serum 360-380 mg% and for erythrocytes 130-160 mg%, and he assumes that the chlorine content in serum and erythrocytes is almost the same, if only the intraglobular fluid is taken into account without the erythrocyte stroma. Arterial plasma always contains more Cl than venous plasma (according to Brunetti, by 12 mg%). Many researchers note fluctuations in the Cl content in plasma after food intake. During muscular work, changes in the Cl content in K. are inconsistent. The determination of chlorides in K. has no special clinical significance, since their accumulation in the blood usually does not occur, because when chlorides are retained in the body, they pass into the tissues along with water. Most often, fluctuations in the Cl content in K. should rather be attributed to thickening or thinning of K., rather than to true hyper- or hypochloremia. Ambard proposed a coefficient indicating the ratio between the amount of chlorides in urine and in blood; but this coefficient has not received practical significance. In nephroses (with edema), the amount of sodium chloride in K. is sometimes decreased, whereas in interstitial glomerulonephritis it may be increased. The amount of chlorides is decreased in diabetes (mellitus and insipidus), fever, pneumonia (before the crisis, however, the amount of chlorides is increased); it is also decreased in anemia. At the height of digestion, a decrease in chlorides in the blood is observed; at the same time, an increase in the amount of bicarbonates in K. is noted (see also Mineral metabolism). Determination of chlorides by Prikladovitsky and Apollonov. --Reagents: 1) n/10 solution of NaCl (0.5846 g of chemically pure dry NaCl is dissolved in 1 liter of doubly distilled water); 2) П/10 solution of AgNO3; the titer is established against П/100 solution of NaCl (1) with K2CrO4 indicator; 3) П/10 solution of KJ + J2: in 20 cm3 of water dissolve 0.83 g of KJ, add 0.2 g of iodine and add water to 500 cm3; the titer is established before each titration against AgNO3 (2): 2 cm3 of П/100 solution of AgNO3, 0.05 cm3 of HNO3(1:3), 3-5 cm3 of water, 3-4 drops of aqueous starch solution are introduced into a flask and titrated with iodine solution (3) to a weak blue coloration; 4) nitric acid in dilution 1:3; 5) saturated solution of KMnO4; 6) glucose solution; 7) aqueous starch solution. --Method of determination. In an Erlenmeyer flask with a capacity of 25-35 cm3, place 2-3 cm3 of water and 0.1 cm3 of K. or plasma. The pipette is rinsed several times with the liquid in the flask. Add 2 cm3 (for K.) or 1 cm3 (for plasma) of HNO3 solution (4), 2 cm3 of П/100 solution of AgNO3 (2), heat on a sand bath to boiling, add 15-20 drops of saturated KMnO4 solution and boil for 10-12 min. After boiling, add, while shaking, dropwise a glucose solution until decolorization. After cooling, the contents of the flask are filtered, rinsing the flask and washing the filter 3 times with water (3 cm3). To the completely transparent filtrate, add 3-4 drops of starch solution and titrate the excess AgNO3 with iodine solution (3) until the appearance of a weak blue coloration. --Calculation: the amount of Cl in mg% = [A-(B-0.01)]355, where A is the amount of cm3 of AgNO3 solution added, B is the amount of cm3 of iodine solution used for back-titrating the excess AgNO3, 0.01 cm3 is the correction for coloration. Bicarbonate ion HCO3-. The average content in plasma and venous blood is 0.15% HCO3-; in normal conditions, its amount is subject to significant fluctuations depending on the CO2 content in K. (see Buffer properties of blood) and is significantly decreased in acidosis. Phosphorus in K. is present both in the liquid part and in the formed elements. The formed elements are richest in phosphorus. Abderhalden proposed to distinguish three fractions of phosphorus in K.: 1) phosphorus of lipoids, 2) phosphorus of proteins, and 3) inorganic phosphorus. Grünwald also distinguishes acid-soluble phosphorus, which he understands as the phosphorus of those compounds that pass into solution during protein precipitation <i97 П o л Normal P content in mg% in humans Total amount Acid-soluble Inorganic Lipoid Residual Male Female Male Female Plasma 7.7-13.8
9.8-13.0 \ 3.0-4.5 I 2 Blood cells 58.5-102.7 ! 44.3-79.1 ! 3 89.0- 84.7 | 50.6-65.2 -3.8 -4.4 -8.6 3.1-8.3 5.1-7.4 6.0-9.2 13.7-20.0 14.9-19.8 0.1-1.3 0.5-1.3 38.9-75.8 42.3-59.5 With acids (e.g. trichloroacetic). This acid-soluble phosphorus includes 1) inorganic phosphorus and 2) phosphorus of organic esters of phosphoric acid of still unknown nature (Geibner). Feigl designates this second part as residual phosphorus. In plasma and serum, inorganic phosphorus predominates; organically bound phosphorus (except for the phosphorus of lipoids) is present only in traces (0.2-0.6 mg%, according to Feigl); in erythrocytes the relationship is the reverse. In rickets, the amount of inorganic phosphorus in blood is lowered, which is characteristic of rickets. Improvement in the clinical condition of rickets is preceded by an increase in inorganic phosphorus in blood, so that during therapeutic measures one can observe their effect by the curve of inorganic phosphates in blood.-- In tetany, the amount of phosphates is normal; in rare cases of childhood tetany without simultaneous rickets, even increased amounts of phosphorus were found.-- In insufficiency of the parathyroid glands, increased amounts of phosphorus in blood were observed. In large bone fractures in adults, along with a slight increase in calcium in blood, there is quite a considerable increase in the amount of phosphorus in blood; it can persist for several days and up to 2-4 weeks. After union, the amount of phosphorus gradually falls. As a rule, in the absence of formation of bony callus after fracture, no increase in phosphorus in blood is observed. In chronic nephritis with retention of nitrogenous products in blood, there is also a significant increase in the amount of phosphorus in blood. Along with an increase in phosphorus, there is usually an increase in acidosis (the reserve alkalinity decreases).-- With heavy physical work, the amount of phosphorus in blood is usually increased; with mental work it increases by the end of the working day, but returns to normal during the night (Gefter and Yudelovich) (for more details--see Metabolism, mineral, Fatigue). In winter, the content of P in blood is the lowest, in spring--the highest (Hess). There are indications that these fluctuations depend on the action of ultraviolet rays.-- Compounds of P in blood participate in carbohydrate metabolism, influence the intensity of glycolysis (see). Determination by Fiske-Subbarow-Braunstein (Fiske, Subbarow). The method is based on the fact that the phosphorus of blood forms with ammonium molybdate a complex compound, which is reduced by aminonaphtholsulfonic acid (eikonogen) with the formation of molybdenum blue. At the same time as the test substance, a standard solution of phosphorus of definite concentration is treated. The color of the solutions is compared in a colorimeter.--Reagents: 1) 25 g ammonium molybdate are dissolved in 1 l of water; 2) 5% solution H2SO4; 3) solution of eikonogen: 15 g NaHSO3 and 0.5 g Na2SO3 are dissolved in approximately 50 cm3 of water; 0.25 g eikonogen is added and brought to 100 cm3 with water; before use, part of this basic solution is diluted 4 times; 4) standard solution: 383.3 mg KH2PO4 are dissolved in water (in a measuring flask to 1 l), 20 cm3 of n/10 solution H2SO4 are added and brought to the mark (1 cm3 of this solution corresponds to 0.2 mg P2O5); 5) 22% solution of trichloroacetic acid; 6) 0.85% solution of NaCl; 7) hydrogen peroxide (Perhydrol); 8) n/10 KMnO4; 9) chemically pure H2SO4 (specific gravity 1.84); 10) freshly prepared mixture of equal volumes of 1st and 2nd solutions. Eikonogen--photographic developer. Its solution should be colorless, otherwise it is purified as follows: heat 1,000 cm3 H2O to 90° and dissolve in it 150 g NaHSO3 and 10 g crystalline Na2SO3. To the mixture add 15 g eikonogen, shake, after dissolving filter, cool and add 10 cm3 concentrated HCl. The precipitate is suctioned off on a Büchner funnel; first wash with water, then with alcohol, until the running alcohol becomes colorless. Dry in the air in a dark place and store in a dark bottle.-- Procedure of determination. 1. Inorganic phosphorus. Into a centrifuge tube, introduce 2 cm3 of NaCl solution (6) and 1 cm3 of freshly taken blood (one cannot use anticoagulants!); rinse the pipette several times, drawing in and releasing through it the resulting solution. Add 1 cm3 of trichloroacetic acid solution (5), shake and after 10 min. filter or centrifuge. The centrifugate (filtrate) is treated simultaneously with the standard solution. Into a test tube take 2 cm3 of centrifugate, 2 cm3 of reagent (10), 1 cm3 of eikonogen solution (3). Into a 25 cm3 volumetric flask introduce 2 cm3 of standard solution (4), 2.5 cm3 of trichloroacetic acid (5), 10 cm3 of eikonogen solution (3) and bring to the mark with water. The test tube and flask are placed simultaneously for 5 min. in a water bath at 37°, cooled and colorimetered. The calculation is made for the Autenrite colorimeter by means of a curve empirically established for a given clinic, cuvette and reagents; for the Dubosk colorimeter--by the formula: P2O5 in 100 cm3 of blood= standard reading .16 „, .", "„ _ - mg% ; 1 mg P2O5: 0.437 mg P= test reading = 1.38 mg H3PO4. 2. Acid-soluble and total phosphorus.--For determination of total P in blood, into a Kjeldahl flask introduce 0.5 cm3 of freshly taken blood, diluted 10 times with water; for analysis of acid-soluble P, take 0.25-0.50 cm3 of the filtrate after precipitation of proteins with trichloroacetic acid. The further analysis proceeds the same way. To the contents of the flask add 2 cm3 of H2SO4 solution (2), throw in a glass bead, close the flask with a glass slip and heat on a weak flame until all water has evaporated, after which heat for another 5 min. on a strong flame. To the cooled liquid add 2 drops of perhydrol (directly to the bottom of the flask) and heat until complete decolorization, which persists for 5 min. If decolorization does not occur, add more perhydrol until it does. After decolorization, the test and standard solutions are treated simultaneously. Into the Kjeldahl flask add 5.5 cm3 H2O, rinsing the glass slip and walls, 0.5 cm3 of KMnO4 solution (8), 2 cm3 of molybdate solution (1), 2 cm3 of eikonogen solution (3). Into a 25 cm3 volumetric flask introduce 2 cm3 of standard solution (4), 5 cm3 of H2SO4 solution (2), 1.25 cm3 of KMnO4 solution (8), 5 cm3 of molybdate (1), 5 cm3 of eikonogen solution (3) and bring to the mark with water. Both flasks are placed for 5 min. in a water bath at 37°, cooled and colorimetered.--Calculation
The calculation is made for the Autenrite colorimeter by means of a curve empirically established for a given clinic, cuvette and reagents; for the Dubosk colorimeter--by the formula: P2O5 in 100 cm3 of blood= standard reading .16 „, .", "„ _ - mg% ; 1 mg P2O5: 0.437 mg P= test reading = 1.38 mg H3PO4. 2. Acid-soluble and total phosphorus.--For determination of total P in blood, into a Kjeldahl flask introduce 0.5 cm3 of freshly taken blood, diluted 10 times with water; for analysis of acid-soluble P, take 0.25-0.50 cm3 of the filtrate after precipitation of proteins with trichloroacetic acid. The further analysis proceeds the same way. To the contents of the flask add 2 cm3 of H2SO4 solution (2), throw in a glass bead, close the flask with a glass slip and heat on a weak flame until all water has evaporated, after which heat for another 5 min. on a strong flame. To the cooled liquid add 2 drops of perhydrol (directly to the bottom of the flask) and heat until complete decolorization, which persists for 5 min. If decolorization does not occur, add more perhydrol until it does. After decolorization, the test and standard solutions are treated simultaneously. Into the Kjeldahl flask add 5.5 cm3 H2O, rinsing the glass slip and walls, 0.5 cm3 of KMnO4 solution (8), 2 cm3 of molybdate solution (1), 2 cm3 of eikonogen solution (3). Into a 25 cm3 volumetric flask introduce 2 cm3 of standard solution (4), 5 cm3 of H2SO4 solution (2), 1.25 cm3 of KMnO4 solution (8), 5 cm3 of molybdate (1), 5 cm3 of eikonogen solution (3) and bring to the mark with water. Both flasks are placed for 5 min. in a water bath at 37°, cooled and colorimetered.--Calculation
p p„ „ standard reading. 320 „. for general P:P.OjbK. =-----------------^-^---------- mg%. experiment reading Sulfur. Data on normal and pathological concentration of sulfates in B. are not uniform; there are few studies, and determinations were mostly performed in the ash, where part of the sulfates is formed during the combustion of protein sulfur. Geibner and Meyer-Bish found in the dialysate of serum free sulfuric and ether-sulfuric acids approx. 19 mg% in normal conditions (including 6-8 mg% in the form of ether-sulfuric) and up to 42 mg% in pathological cases. Loeper, Olivier and Tonnet established the ratio between the amount of sulfur in sulfuric acid and the total amount of sulfur: 80% S accounts for oxidized sulfur and 20% S for so-called neutral sulfur. This ratio changes in favor of decreased oxidized sulfur in liver diseases, while neutral sulfur remains unchanged. Neutral sulfur increases in Addison's disease due to the formation in the body of pigments containing a large amount of sulfur. The total amount of sulfur increases in kidney lesions accompanied by azotemia (see Metabolism, mineral). Determination of sulfates by the method of Hubbard, modified by Wakefield. Principle: sulfates are precipitated with a solution of benzidine, the precipitate is dissolved in HCl, to the resulting solution hydrogen peroxide and ferric chloride are added and then colorimetry is performed, comparing the developed yellow color with the color of a similarly treated standard solution of benzidine chloride. Necessary reagents: 1) standard solution: a) 2.0071 g of benzidine chloride are dissolved in 500 cm3 of 0.2 n solution of HCl; 1 cm3 of this solution is equivalent to 1.5 mg of sulfate; b) by diluting solution "a" with 0.2 n hydrochloric acid, standard solutions are prepared, 1 cm3 of which is equivalent to: 0.15; 0.03; 0.015 mg of sulfate (SO4); 2) 20% solution of sulfuric acid-free trichloroacetic acid; for purification, to the melted trichloroacetic acid, a solution of benzidine is added (for 100 cm3 of acid - 5 cm3 of 0.5% solution of benzidine) and it is distilled under reduced pressure; the distillate is free from sulfates and from benzidine; 3) hydrogen peroxide (commercial Perhydrol), free from sulfates; before use, it is diluted 1:5 with distilled water; 4) 0.5% aqueous solution of FeCl3, not containing sulfates; 5) pure acetone (purified by distillation); 6) 0.5% solution of benzidine in acetone; the appearance of yellow color is a sign of reagent inadequacy. Method for determination of inorganic sulfates in blood serum. After coagulation of B., collected in a dry test tube, it is centrifuged and 3 cm3 of serum are taken into a centrifuge test tube with a capacity of 15 cm3, 3 cm3 of water are added, 3 cm3 of 20% trichloroacetic acid and brought to 15 cm3 with water. It is mixed and centrifuged for 5 minutes; 5 cm3 of the clear centrifugate (C) are transferred to another centrifuge test tube, 10 cm3 of solution (6) are added and the tube is stoppered to prevent evaporation of acetone. After at least 1/3 hour, it is centrifuged for 30 minutes at a speed of 3,000 revolutions per minute. The liquid is poured off, and the residue is removed by inverting the tube on dry filter paper for 3 minutes. Wiping the edge of the tube, 15 cm3 of pure acetone are poured into it. After stirring the precipitate with a thin glass rod, the tube is stoppered and centrifuged again for 15 minutes at the same speed. Pouring off the liquid and again inverting the tube on dry filter paper, the edges of the tube are wiped after 5 min. and 2 cm3 n HCl solution are added. If the precipitate does not dissolve upon shaking, the tube is slightly warmed, without bringing the liquid to a boil. After cooling, 6 cm3 of water, 1 cm3 each of solutions (3) and (4) are added, thoroughly mixed and after 5 minutes colorimetry is performed, comparing the color with the standard solution. The concentration of HCl in the test and standard solutions must be the same, and both solutions must be processed simultaneously. The greatest color developed after 5 minutes persists for 10 minutes; adding 0.5 cm3 each of concentrated HCl to both the standard and test solutions prevents rapid fading of the color. Calculation. The amount of mg SO4 in 100 cm3 of serum = w. 100, where s is the standard reading, i is the test solution reading, w is the amount of mg-SO4 equivalent to the benzidine content in the standard. Serum containing large amounts of sulfates should be diluted more than 1:5 during protein precipitation. With a content of 0.06 mg SO4 in the sample, the colorimetry conditions are optimal. Determination of the total amount of SO4 in serum. After protein precipitation, to 5 cm3 of centrifugate (C) (see above) 2 drops of concentrated HCl are added and the centrifuge test tube is immersed in a beaker with boiling water for 15 min. (hydrolysis)-. After cooling, 10 cm3 of reagent (6) are added and the procedure is continued as in the determination of inorganic sulfates. The content of inorganic SO4 found in serum by this method is 0.5-1.8 mg%, of the total amount of SO4 - 2.3-4.5 mg%. Determination by Denis. In the filtrate after precipitation of B. or plasma proteins, a precipitate of BaSO4 is obtained, the amount of which is determined nephelometrically. Solutions: 1) a) 0.5437 g K2SO4 are dissolved in 1 l of water; b) 10 cm3 of solution (a) are mixed with 90 cm3 of water (1 cm3 contains 0.01 mg S); 2) 5 g HgCl2 are dissolved in 100 cm3 of water; 3) 1 g BaCl2·2H2O are dissolved in 100 cm3 of water; to solutions 2 and 3, 0.5 cm3 each of HCl (specific gravity 1.125) are added; 4) 1% solution of (NH4)NO3. Procedure. 5 cm3 of blood, serum or plasma are mixed with 5 cm3 of n/10 HCl and 5 cm3 of solution of corrosive sublimate (2), 0.3 g HgCl2 in powder, are added, mixed and after an hour, during which the mixture is frequently and vigorously shaken, it is filtered through an ashless filter; 5 cm3 of the clear filtrate are mixed with 1 cm3 of solution (NH4)NO3 (4) and 4 cm3 of solution BaCl2 (3). For the standard, 10 cm3 K2SO4 (1), 10 cm3 of solution of corrosive sublimate (2), 4 cm3 of solution (NH4)NO3 (4), 1 cm3 of solution BaCl2 (3) are taken. 10 min. after turbidity of the solutions, they are compared in a nephelometer. 1.5=.ig S in 100 cm3 of B. experiment reading Iodine is present in B. in minimal amounts: from 0.002 mg% to 0.013 mg%. According to Veil's data, in normal conditions the iodine content in human B. is quite constant, individual fluctuations are insignificant; up to 65% J is in the form of organic compounds and 35% in the form of inorganic. In summer the iodine content is higher than in winter. Introduction per os of 0.5 g causes after 11/2 hours an increase to 1 mg%, gradually returning to normal within 24 hours. Injections of adrenaline and atropine increase the iodine content, while pilocarpine and choline decrease it. Hyperthyroidoses occur with an increase in iodine concentration in B. After strumectomy, the amount of iodine in B. decreases in parallel with the decrease in basal metabolism. During menstruation and in the last months of pregnancy, hyperiodemia occurs. In blood diseases (pernicious anemia, leukemia), hyperiodemia is observed (Veil u. Sturm) (see Metabolism, mineral). Determination of iodine in B. Method of Fellenberg. Principle. After ashing B., iodine, which in the ash is in the form of iodides, is extracted with alcohol. The alcohol extract is ashed again, and iodine in the aqueous solution of the ash is either colorimetrically determined after its extraction with a mixture of sulfuric acid with nitrite or titrated after its conversion into iodate. With this method, amounts of iodine in 0.1-0.3 v. (1 v=10-6) can be determined. Bromine. Content in human B. - about 0.5-1.5 mg% (Gautier, Bernhardt and Ucko). Aluminum, silicic acid, hydrogen sulfide, arsenic, lithium, zinc, copper, lead, silver, manganese have been found in blood in traces. Iron is present in B. in the form of an organic compound in the Hb molecule. Its content in B. =50-60 mg%. Fluctuations in the content of iron go in parallel with changes in Hb. Normally, there is no iron in serum; according to Jolles and Erben, in severe hemolytic anemias traces of iron are found in serum; this is not observed in chlorosis and leukemia. Determination of iron by Bergman. To the mineralized B., ammonium thiocyanate and acetone are added. Solutions of iron oxide give a dark red color with ammonium thiocyanate solution: FeCl3 + 3 (NH4) CNS = 3NH4Cl + Fe(CNS)3. In parallel, a standard solution is treated similarly.
Reagents: 1) approximately 34% solution of HBr; 2) n/10 solution of KMnO4, containing no iron; 3) chemically pure acetone; 4) standard iron solution [a) 4.3557 g of dry, chemically pure FeCl3·6H2O is dissolved in water, making up to 1 liter; b) 1 cm3 of this solution is diluted to 100 cm3 with water (in 1 cm3 - 0.009 mg Fe)]; 5) NH4CNS (38% solution); 6) n/10 solution of HCl. Method of determination: into a test tube, introduce 2 cm3 of H2O and 0.04 cm3 of blood; the pipette is rinsed with the resulting solution. Add 0.2 cm3 of n/10 HCl, 2 cm3 of n/10 KMnO4, and place the test tube in a boiling water bath for 2 minutes. A brown precipitate forms. Add 2 drops of HBr (1) and again place in a boiling water bath for 2 min. The precipitate dissolves: if the liquid is not clear, add another drop of HBr and heat. The liquid is filtered through a compressed ashless filter into a narrow graduated cylinder with a capacity of 20 cm3. The filter is carefully washed with H2O until the liquid level in the cylinder reaches 5 cm3. Into another cylinder of the same capacity, pour 2 cm3 of the iron chloride solution (4b), the same number of drops of HBr as in the first, place in a boiling water bath for 4 min, after which make up to 5 cm3. Into both cylinders, as simultaneously as possible, introduce 5 cm3 of the (NH4)CNS solution (5); after mixing, add 10 cm3 of acetone (to make 20 cm3); mix again, stopper the cylinders, and after 5 min, perform colorimetry. The colorimetric reading should be done quickly so that the acetone does not evaporate. Calculation. K taken - 0.04 cm3. Amount of iron in standard - 0.018 mg. Dilution of K and standard is the same, amount of Fe in K = H2·0.018·100 / N2 - reading of standard, x / 0.04
Hi H,-отсчет опыта. Water. The water content in Blood depends on many factors: processes of exchange in tissues, excretory function of the kidneys, evaporation of water, concentration of protein in Blood, binding of water by plasma colloids, type of nutrition, species and age of the animal. Despite this, the water content in Blood under physiological conditions is relatively constant. For the water content in Blood of various animals, see the table of Abderhalden, given above. On determining the water content in Blood, on fluctuations in its content-see Hydremia, as well as Metabolism, water. Extractive substances of Blood. are divided into two main groups-nitrogenous and non-nitrogenous. The first include urea, amino acids, uric acid, purine bases, creatine, creatinine, allantoin, carbamic acid, hippuric acid, indoxyl, as well as ammonia. The nitrogen contained in all the listed substances is often determined collectively-in the filtrate obtained after precipitation of Blood proteins, and is combined under the general name of non-protein or residual nitrogen of Blood (RN). In RN of Blood are also in small amounts albumoses, peptones, seromucoid and protein acids. Depending on the method used for precipitation of Blood proteins, the amount of RN will be different; under normal conditions for human Blood the content of residual nitrogen is equal: by BaHrv- 19-39 mg%, by Folin(РоНп)-28-42 mg%, by Gettler and Baker - 30 - 45 mg%, by Hammett - 35.6mg%.-Various substances, the nitrogen of which is part of the so-called residual nitrogen, are contained in normal Blood in the following amounts: urea-19-32 mg% (N of it constitutes 2/5 of the total residual nitrogen of Blood);. ammonia-0.02-0.03 mg%, amino acids - 6-7 mg%; creatine-3-7 mg%; creatinine-1-2 mg%; uric acid-2-3 mg %; indoxyl-0.025-0.082 mg%. To the total amount of N should be added about 2 mg of nitrogen attributable to phosphatides. Some substances, e.g. urea and other components of residual nitrogen, which are also part of urine, are only end products of metabolism, subject to excretion from the body; while some amino acids serve as nutritional material for cells and tissues. Urea is distributed approximately equally between plasma and erythrocytes, while amino acids and NH3 are contained in larger quantities in the formed elements.-With violation of intermediate metabolism in Blood, the fraction of amino acids increases. By the amount of RN in Blood one cannot judge the delay of RN in tissues, since between these quantities there is often no parallelism;; the richest in RN are muscle tissue, as well as the spleen. Connective and especially fatty tissues contain a negligible amount of RN. An increase in the amount of RN is observed in various pathological processes, especially in kidney lesions: most of all-in far advanced nephroscleroses, in acute glomerulonephritis, as well as in poisoning with corrosive sublimate, bilateral kidney cysts, reflex and mechanical anurias and especially in uremia (see.) azotemic type. The retention of nitrogenous products in Blood is also observed due to extrarenal causes. Thus, with lesions of the cardiovascular system, the content of RN may be slightly elevated. With gastrointestinal disorders, accompanied by vomiting and diarrhea, due to thickening of the blood, as well as with intestinal obstruction, an increase in RN is observed. It also occurs in febrile processes, pneumonia, lead poisoning, which is often accompanied by kidney lesions, diabetes, acute yellow atrophy of the liver and a number of other diseases accompanied by enhanced processes of tissue breakdown (autolysis). The amount of RN was found to be reduced in normal pregnancy (see also Protein metabolism, Nephritis, Nephrosclerosis).Ю. Geftler, S. Severin. When determining RN of Blood, it should be protected from clotting by preparations of oxalic acid salts (Na2C2O4; CaC2O4; Li2C2O4) in an amount of about 20 mg per 10 cm3 of blood. Removal of proteins, which is necessary in various blood analyses, can be done in various ways. 1. By Folin. Reagents: 1) 10% solution of sodium tungstate (Na2WO4.2H2O). The preparation should easily dissolve in cold water and should not contain a large amount of carbonates. For 10 cm3 of the prepared reagent during titration, no more than 0.4 cm3 of n/10 solution of HCl (indicator phenolphthalein) should be used; 2) 2/8 n solution H2SO4.- Precipitation: to a portion of Blood (5--10 cm3), hemolyzed by adding 7-fold volume of water, in a flask of 100-150 cm3 capacity, 1 volume of reagent (1) and dropwise with constant stirring 1 volume of reagent (2) is added. Thoroughly shaken, left to stand for 5 min. The color of the clotted protein changes from dark red to dark brown. If this does not happen, then the clotting of protein occurred unsatisfactorily (usually due to excess of added oxalate). The analysis can sometimes be saved by careful addition of 10% solution of H2SO4 until foaming stops and until a brown color appears (shaking after adding each drop). The resulting mixture is filtered through a dry filter, back pouring the first portions of the filtrate onto the filter.-2. By Benedict and Newton. Reagents. 1) Solution of sodium molybdate: 25 g of molybdic acid (chemically pure) is boiled with 125 cm3 of a solution of NaOH until practically complete dissolution is achieved. The resulting solution is filtered, the filter is washed with 100 cm3 of water and the cooled filtrate is brought to 500 cm3 with water. 2) 0.4 n solution H2SO4- For precipitation of proteins, a pre-prepared mixture of equal volumes of reagents 1 and 2 is used.-Precipitation: 1 volume of blood <5-10 cm3) is hemolyzed by adding 7 volumes of water; to the resulting solution, 2 cm3 of the mixture of reagents 1 and 2 is added, shaken and filtered.- 3. By Schenk. Reagents. 1) 5% solution of HgCl2, 2) 2% solution of HCl.-Precipitation. To 1 volume of Blood, 1 volume of water and 2' volumes of solutions 1 and 2 are added, thoroughly shaken and after several hours (no more than 24) filtered. In the filtrate, mercury is precipitated by hydrogen sulfide, from which, after filtering off HgS, they are freed by suction of air. The resulting filtrate can be concentrated by evaporation in vacuum under weakly acidic reaction.-4. By Michaelis and Rona. Precipitation. Diluting Blood 10-15-fold with water, add 5% solution of colloidal iron hydroxide (calculated per 1 cm3 of Blood 4 cm3 of hydroxide solution) and several cm3 of 10% solution of MgSO4 (one can also add 0.1-0.2 g of MgSO4 in powder). The mixture is thoroughly shaken (2-3 min.) and, after standing for 10 min., filtered. If the resulting filtrate is still colored (contains Hb), then a solution of iron hydroxide should be added again to finally precipitate traces of protein. The resulting clear filtrate, acidified with acetic acid, can be concentrated by evaporation under reduced pressure. To remove protein from serum or plasma, smaller amounts of iron hydroxide are needed: per 1 cm3 of serum 1 cm3 of iron hydroxide solution.-5. With trichloroacetic acid (10- 20% solution). To hemolyzed Blood, with constant shaking, a solution of trichloroacetic acid is added in such an amount that the final concentration of trichloroacetic acid is not less than 2.5% (e.g. in a measuring flask with a capacity of 50 cm3, containing 25 cm3 of water, 8 cm3 of Blood is placed; with constant shaking, 12-13 cm3 of 12% solution of trichloroacetic acid is added and brought to the mark with water). Foaming is prevented by adding octyl alcohol (1 drop).-6. By Bang. Reagents. In a porcelain dish, place 10 g of sodium phosphomolybdate, 10 g Na2SO4 and 150 cm3 of water; add 15-20 drops of 25% solution of NaOH and boil for 15 min. After cooling- the contents of the dish are completely transferred to a two-liter measuring flask, rinsing the dish several times with water, add 30 g (16 cm3) of concentrated H2SO4, 0.5 g of glucose and brought to the mark with water.-Precipitation. On Bang's paper (see Bang micromethods), impregnated with 100-120 mg of Blood, allow to dry in air (about 5 min.), then place it in a test tube, into which Bang's reagent is poured in such an amount that it completely covers the entire paper. After 1 hour, the contents of the test tube are filtered. Using Bang's reagent, one can of course precipitate Blood proteins without applying the latter to paper.-7. From Blood proteins one can also be freed by ultrafiltration. The largest values for RN of Blood are obtained using trichloroacetic acid for precipitation of proteins, the smallest-using phosphotungstic acid. The difference is about 2 mg per 100 cm3 of Blood.
This amount of N is denoted as peptide nitrogen. - In the protein-free blood filtrate, the nitrogen of organic compounds and ammonia is determined by Kjeldahl's method (see Kjeldahl's method). Methods for determining residual nitrogen. 1. Bang's method. The formed NHS is absorbed by a titrated solution of acid (see Kjeldahl's method). The excess acid in the receiver is determined by iodometric or acidimetric titration (the latter being more precise). Reaction course: 3H2SO4 + 5KJ + KJ03 = 3K2SO4 + 3H20 + 3J2 (a) 6J + 6 Na2S203 = 6NaJ + 3Na2S406
(b) An excess of acid in the receiver, not bound by NH3, releases, as seen from equation (a), an equivalent amount of free iodine, which is determined by titration with hyposulfite (b).-The difference in the amount of cm3 of hyposulfite (1 equivalent of hyposulfite corresponds to 1 gram-atom of N) used in titrating the acid in the receiver after distilling a blank test (control) on one side and the test liquid on the other, will indicate the amount of NH3 in the latter, and consequently N (see Iodometry).- 2. Folin's method.- After precipitating blood proteins by Folin's method, to 5 cm3 of the filtrate placed in a Jena glass tube with two marks (corresponding to 35 cm3 and 50 cm3), add 1 cm3 of the mixture for mineralization. By heating on a small flame, the contents of the tube are brought to a boil and boiled until completely decolorized. After cooling, the contents of the tube are brought to 35 cm3 with water, 15 cm3 of Nessler's reagent are added, it is centrifuged if necessary, and then it is colorimetrically compared with the color of a standard solution (see below).-Preparation of the combustion mixture (mineralization). To 50 cm3 of a 5% solution of copper sulfate, add 300 cm3 of 85% phosphoric acid. After mixing, add 10 cm3 of concentrated chemically pure H2SO4. For mineralization, use a mixture diluted with water (1:1). Preparation for colorimetry of the standard solution. 3 cm3 of the solution (NH4)2SO4 [0.4716 g of chemically pure (NH4)2SO4 in 1 liter of ammonia-free water: 10 cm3 of solution = 1 mg N] is measured into a 100 cm3 volumetric flask, to which 2 cm3 of the diluted mineralization mixture, approximately 60 cm3 of water, 30 cm3 of Nessler's reagent, and water to the mark are added. Nessler's reagent is added to the test and standard solutions simultaneously if possible.-Calculation: t .0,3. .100 mg% N (H2-height of the column of standard solution during colorimetry, H1-height of the column of the test liquid).-The given calculation is valid when maintaining the ratios indicated for protein precipitation by Folin's method and for the further course of the analysis. Methods differing slightly from Folin's method are those of Folin and Denis (Denis), precipitating proteins with metaphosphoric acid, Acel (Acel), proposing to work with smaller amounts of starting material, Grigaut and Guerin, precipitating blood proteins with trichloroacetic acid, and A. and L. Palladins, working similarly to Acel with Nessler's reagent prepared according to Winkler.- 3. Podgoretsky's method, improved by Engelhardt and Lyubimova. Precipitation of proteins with trichloroacetic acid, mineralization of the blood filtrate in Kjeldahl flasks with a 50% solution of H2SO4 without a catalyst. After combustion in Kjeldahl flasks, containing one-mineralized test liquid, the other-control (reagents without test blood filtrate), 5 cm3 of water, a few drops of indicator-methyl red solution, and 2 portions of NaOH solution are added to each flask until neutral reaction. After adding 1 cm3 of NaBrO solution to each flask and allowing to stand for 10 minutes, 0.5 cm3 of 5% KJ solution, 1 cm3 of HCl solution, a few drops of starch solution are added, and after 3-4 minutes, the liberated iodine is titrated with hyposulfite solution. The difference in the amount of cm3 of Na2S2O3 solution used in titrating the contents of the control samples (a cm3) and the test samples (b cm3), will give an idea of the amount of ammonia and consequently nitrogen in the portion of filtrate taken for analysis. The reactions proceed according to the following equations: control sample (not containing NH3)-NaBrO + 2KJ + 2HCl = NaBr + H2O + 2KCl + 2J; test sample (containing NH3)-2NH3 + 3NaBrO = N2 + 3H2O + 3NaBr; Thus, one molecule of NH3 corresponds to 3 equivalents of iodine; 1 cm3 of n/10 Na2S2O3 solution corresponds to 14.008/3×200 = 0.0233 mg N. Multiplying the difference (a-b) cm3 by 0.0233, we find the nitrogen content in the test portion of the filtrate.-Preparation of alkaline NaBrO solution: a) basic solution: 120 cm3 of 5% NaOH solution, 1 cm3 of bromine and up to 375 cm3 of water. During preparation, the mixture must be cooled with snow or cold water; b) before analysis, to 5 cm3 of solution 'a' add 45 cm3 of n/10 NaOH solution. Albumoses, as a component of non-protein nitrogen, apparently do not exist in blood in a preformed state under normal conditions; rather they are a product of blood treatment with various reagents 705 (protein precipitants). Under pathological conditions, albumoses as products of autolytic breakdown of cell proteins can appear in blood, especially in extensive suppurations, and in parturient women. In myeloid leukemia, albumoses and peptones were often found in blood; their presence was also indicated in sarcoma. Urea, the nitrogen of which constitutes about 1/2 of the total residual nitrogen of blood, is evenly distributed between the formed elements and plasma. The amount of urea in blood under physiological conditions varies within wide limits, reaching during intense muscular work 70-80% of the total residual nitrogen. Injection of adrenaline into blood, as well as irritation of the splanch-nici majoris, leads to an increase in urea content. In uremia, a sharp increase in residual nitrogen (up to 0.3%) occurs mainly at the expense of urea nitrogen, reaching 0.2%. In the blood of selachians, urea content reaches 2.6%. Methods for determining urea in blood.-1. Bang's method. Blood is collected on filter paper in an amount (see Bang's micromethods) of 100-130 mg, placed in test tubes and extracted with a mixture (1:1) of absolute alcohol and ether for 5-24 hours (the test tube is stoppered). The extract is transferred to a Kjeldahl flask* the filter paper is extracted again with alcohol-ether mixture. After evaporation of alcohol and ether, the residue is mineralized by boiling with sulfuric acid in the presence of CuSO4, and NH3 is determined iodometrically (a blank test is necessary), as in the determination of residual nitrogen (see above). The found amount of N, multiplied by 2.143, indicates the amount of urea.-2. Gasometric methods are based on the reaction between urea and hypobromite: CO(NH2)2 + 3NaBrO = 3NaBr + CO2 + 2H2O + N2, where nitrogen is released, and the formed CO2 is absorbed by alkali. Blood is freed from proteins by boiling with acetic acid in the presence of sodium acetate, the filtrate is placed in one of the gas analysis apparatus (van Slyke, Barcroft, Krogh's microspirometer), hypobromite is added, after mixing with which the amount of released N is recorded (either by volume or by measuring the pressure exerted by the released nitrogen on the manometric liquid) (see also Reserve alkalinity). The method is not particularly accurate, because 1) besides urea, other nitrogen-containing substances react with hypobromite; 2) not all urea nitrogen is released under these conditions, so it is necessary to introduce in calculations an experimentally determined coefficient equal to 1.08.- 3. Urease method: decomposition of urea with urease and subsequent quantitative determination of the formed NH3. Reagents. 1) Urease solution: 3 g of permute are shaken with 100 cm3 of 2% acetic acid solution; the acid is decanted and the permute is shaken twice with water. To the moist permute, 5 g of soybean flour and 100 cm3 of 30% alcohol are added. After shaking for 1/4 hour, the mixture is allowed to stand and filtered. The enzyme solution can be stored for a month at low temperature. The suitability of the urease solution is judged by determining the urea content in a solution of known concentration. 2) Phosphate buffer mixture: 69 g of NaH2PO4 + H2O and 179 g of Na2HPO4 + 12H2O are dissolved in warm water and brought to 1 liter with water. 3) Titrated n/5 sulfuric acid solution. To a certain volume of blood filtrate after protein precipitation (e.g., 10 cm3), add 30 cm3 of buffer mixture, 2 cm3 of urease solution (1) and heat in a water bath at 50° for 45 minutes. After the specified time, the formed ammonia is distilled into acid solution (3) and determined by titration iodometrically or acidimetrically or colorimetrically using Nessler's reagent. The ammonia can be left undistilled and determined colorimetrically in the same test tube where urea decomposition took place.
Amino acids are contained in significantly greater quantities in erythrocytes than in plasma: in erythrocytes - 9.5% of the total nitrogen content, in plasma - 1.5% of the total nitrogen content. Various amino acids are adsorbed by erythrocytes to different extents. Under normal conditions, human blood contains 4-5 mg% of nitrogen in the form of amino acids; under pathological conditions, a sharp increase in amino acid content can be observed (for example, in leukemia, phosphorus poisoning, liver damage). Several methods have been proposed for the determination of amino acids. I. Bang's method. A paper strip moistened with blood is first extracted with a mixture of absolute alcohol and ether to remove urea (one can use the paper strip remaining after extraction with alcohol and ether when determining urea in blood by Bang's method), and then with Bang's reagent to precipitate proteins. In the second extraction, amino acids pass into the solution, the nitrogen of which can be determined by the same methods as the total nitrogen. II. Folin's method. The determination is based on the color reaction of amino acids with 1,2,4-naphthoquinonesulfonic acid sodium. --Reagents: 1) 10% solution of sodium tungstate and 2/3 N solution of H2SO4 for protein precipitation; 2) standard glycine solution: 37.5 mg of glycine in 100 cm3 of N/10 HCl; 3) Na2CO3 solution: 8.5 cm3 of this solution should correspond to 20 cm3 of N/10 HCl (with methyl red indicator); 4) N/10 solution of HCl; 5) freshly prepared 0.5% solution of 1,2,4-naphthoquinonesulfonic acid sodium; 6) 0.25% alcoholic solution of phenolphthalein; 7) mixture (1:1) of 50% acetic acid and 5% solution of sodium acetate; 8) 4% solution of hyposulfite (Na2S2O3·5H2O). - Procedure: into glass test tubes with a capacity of 30-35 cm3, the following is measured: in one (I) 10 cm3 of the filtrate after precipitation of blood proteins by Folin (see above), in another (II) 1 cm3 of the standard solution (0.07 mg of nitrogen) and 8 cm3 of water. Adding one drop of phenolphthalein solution (6) to both test tubes, 1 cm3 of the standard solution and to the test solution dropwise (3-4 drops) of Na2CO3 solution (3) until the pink color of both liquids is the same. After this, 2 cm3 of the freshly prepared reagent (5) is added to both test tubes, they are shaken, and, closing the test tubes with stoppers, left in the dark for 19-30 hours. Then, adding 2 cm3 of the acetic mixture (7) and 2 cm3 of the hyposulfite solution (8) to both, the contents of the test tubes are quantitatively transferred to graduated cylinders, brought to the 25 cm3 mark with water, thoroughly mixed, and colorimetrically measured. - Calculation: the standard liquid contains 0.07 mg N; the amount of nitrogen in the test solution = 0.07
"fluid =-----==- mg, where H2 is the height of the standard fluid column during colorimetry, H1 is the height of the test fluid column. S. Severin. Purines are present in B. in two forms: 1) as free uric acid or its acidic sodium salt, found predominantly in plasma, and 2) as nucleotides, which account for almost twice as much nitrogen as free uric acid. Nucleotides are precipitated mostly along with proteins; thus, the nitrogen contained in them may not be taken into account when discussing individual fractions of non-protein nitrogen (NPN) in blood. The amount of uric acid in normal conditions varies between 1 and 3 mg% and increases with food rich in cell nuclei or ready-made purines. In processes associated with the breakdown of body cells and their nuclei, the amount of uric acid in B. increases; under these conditions, the excretion of uric acid with urine also increases. The amount of uric acid is often elevated in eczema, cancer, febrile conditions, chronic lead poisoning, and kidney damage (in the latter cases along with an increase in other NPN fractions). (See also Nitrogen metabolism, Uric acid.) High values (up to 59 mg%) for uric acid in B. are found in gout. Nevertheless, the mere detection of an increase in uric acid in B. is insufficient for establishing a diagnosis of gout. In gout, the ratio of the highest concentration of uric acid in individual portions of urine to the concentration in blood is significantly reduced. In pneumonia, leukemia, the ratio of the concentration of uric acid in urine to its concentration in B. is normal. Determination of uric acid in blood should be performed after the subject has been on a purine-free diet for at least three days. y. Gefter, S. Severin. Methods for determining uric acid belong to Folin and Benedict; a combined method of these two authors in two modifications is also described here. -Reagents. 1) 100 g of sodium tungstate (Na2WO4·2H2O) are dissolved in 150 cm3 of water; after dissolution, 50 cm3 of 85% phosphoric acid solution are added gradually and boiled on a weak flame for 2 hours. If the solution is colored, it is decolorized with bromine, from which it is then freed by boiling. The resulting solution is quantitatively transferred to a 1-liter measuring flask and brought to the mark with water. 2) Sodium cyanide (NaCN) solution (15 g in 100 cm3 of a 10% NaOH solution). 3) Twenty percent aqueous solution of lithium sulfate. 4) Standard uric acid solution. a) Basic solution: 1 g of pure uric acid is placed in a 1-liter measuring flask, 0.5 g of lithium carbonate in 150 cm3 of water is added, heated to 60° until the uric acid dissolves. Then it is cooled, 25 cm3 of commercial (approximately 40%) formalin, 3 cm3 of glacial acetic acid are added and brought to 1 liter with water. The resulting solution is poured into 100 cm3 bottles, filling them to the top, and closed with paraffin-sealed corks. The solution should be stored in a cool place, b) Solution for colorimetry: 1 cm3 of the basic uric acid solution is placed in a 250 cm3 measuring flask, about 100 cm3 of water, 10 cm3 of 10% H2SO4, 1 cm3 of 40% formalin are added and brought to 250 cm3 with water. In 1 cm3 of the resulting solution there is 0.004 mg of uric acid. 5) Dissolve in water 5.0 g of silver lactate, 5.0 g of lactic acid, add 5 cm3 of 10% NaOH solution and bring to 100 cm3 with water. 6) Ten g of NaCl are dissolved in 0.36% HCl solution, bringing the volume to 100 cm3. Reagents (5) and (6) are used only in the 2nd modification of the method. Blood for uric acid determination must be protected from clotting with lithium oxalate (Li2C2O4), not with sodium or potassium oxalates. Procedure for determination by the 1st modification: in test tubes marked for 25 cm3 are placed: in one - 5 cm3 of the filtrate after precipitation of B. proteins by Folin (see above), in the other - 5 cm3 of reagent (4), containing uric acid (0.02 mg). To both test tubes, 1 cm3 of solution (1), 2-4 drops of solution (3), 2 cm3 of distilled water, 2 cm3 of NaCN solution (2) (shaking) are added, and after 2 minutes they are placed in a boiling water bath for 70-80 sec.; after cooling the test tubes, they are brought to the mark (25 cm3) and colorimetry is performed. - For the 2nd modification: in a centrifuge tube, to 5 cm3 of B. filtrate, 7 cm3 of solution (5) are added, centrifuged, the transparent liquid is decanted, 1 cm3 of NaCl solution (6) is added to the precipitate and mixed; at this point uric acid passes into solution. After adding 4 cm3 of water and mixing, it is centrifuged again. The determined, possibly larger part of the centrifugate is transferred to a measuring flask; water is added to 5 cm3 and then the procedure is as in the first modification. Calculation: in the portion of filtrate (in the first modification) or centrifugate (in the second) taken for analysis, there is uric acid: ^ . 0.02 mg, where H is H2-height of the standard solution column, H1 - height of the test solution column. Creatine and creatinine in B. are distributed between the formed elements and plasma apparently uniformly (there are indications that the content of creatine in formed elements is higher than in plasma). The amount of creatine and creatinine in B. can be judged by Feigl's table (see art. 708). Since creatinine is mainly of endogenous origin, its content in B. can better, than the content of urea, serve as an indicator of insufficient excretory capacity of the kidneys. Determination of creatinine in B. is considered important for prognosis in nephritis; cases with an amount above 5 mg almost always end fatally (Meyers). The increase in the amount of creatinine and residual nitrogen in B. does not go in parallel; a slight increase in creatinine is observed in acute febrile processes (see also Creatinine, Nitrogen metabolism). Determination of creatinine by Folin. To a portion of B. filtrate freed from proteins and neutralized, half the volume of a saturated picric acid solution and 1/10 volume of 10% NaOH solution are added. Simultaneously with the test liquid, a standard creatinine solution is also processed. Colorimetry after 8-10 min. When determining the total amount of creatinine (creatinine + creatine), the filtrate after protein precipitation is mixed with HCl solution in a 5:1 ratio and heated in an autoclave for 20 min. at 130° or 10 min. at 155°. After cooling and neutralization, picric acid and caustic alkali are added according to the prescription above and compared in a colorimeter with a standard solution. The standard solution contains 0.03 mg of creatinine in 5 cm3. Indican is present in human B. in an amount of 0.025-0.082 mg% (see Indican, indicanemia). -Ammonia (NH3) in normal conditions is present in B. in negligible amounts (0.02-0.03 mg%); when determining ammonia some time after taking B., its amount is always found to be elevated (up to 2 mg%). In pathological conditions, the amount of ammonia can increase significantly (for example in cancer, liver diseases). Literary data on the content and changes in the content of ammonia in B. are insignificant, since a satisfactory method for determining ammonia was proposed only in 1924. Folin and Deni's method. To 5 cm3 of oxalate B. in a Kjeldahl flask [fig. 16 (pp. 675-676)] with a capacity of 100 cm3, 3 cm3 of 20% soda solution are added. Through the mixture heated on a water bath to 45°, air is passed, carrying away ammonia, which is absorbed by a 10% sulfuric acid solution in tube b. Flask a contains sulfuric acid for purging the air passing through the system of flasks from NH3. In the receiver, NH3 is determined either by titration or colorimetrically with Nessler's reagent. The most accurate method for determining NH3 in B. is Parnas' method. Lactic acid under normal conditions is present in human blood in an amount of 11-32 mg% (mostly 15 mg%). The amount of lactic acid in B. can sharply increase with intense muscular work (up to 117 mg%) (Hill), in anoxia (both general and local). An increased content of lactic acid in B. has been noted in cancerous neoplasms and sarcomas, pregnancy, eclampsia (see also Glycolysis, Lactic acid). Methods for determining lactic acid. 1. According to Mendel-Goldscheider. Principle of the method: lactic acid is converted by hot sulfuric acid into acetaldehyde, which gives a red coloration with veratrol."
The intensity of coloring corresponds to the amount of aldehyde formed. To hemolyzed blood (1 cm3 of blood + 6 cm3 of water) is added 1 cm3 of freshly prepared 10% solution of metaphosphoric acid for protein precipitation; the liquid is mixed; after several minutes it is filtered and in a certain volume (4 cm3) of the clear filtrate, carbohydrates are precipitated by adding 1 cm3 of a half-saturated solution of CuSO4 and 1 g of calcium hydroxide [Ca(OH)2]. After mixing the mixture, after 1/2 hour it is centrifuged, to 0.5 cm3 of the centrifugate (cooling with ice) 3 cm3 of approximately 85% solution of chemically pure H2SO4 (10 cm3 of water and concentrated acid to 100 cm3) are added and heated on a boiling water bath for exactly 4 minutes. After cooling (with ice) 0.1 cm3 of 0.125% solution of veratrol in pure (not containing aldehyde) alcohol is added and after 20 minutes the color of the test liquid in the Autenrite colorimeter (see Autenrite colorimeter) is compared with the color of a wedge calibrated in advance with standard solutions of lactic acid. In this method, the purity and concentration of H2SO4 is of very essential importance; H2SO4 is tested as follows: 3 cm3 of H2SO4 are cooled with ice and to them is added 0.1 cm3 of veratrol solution (see above), and within 5 minutes no yellow-green coloring should appear. The firm S. A. F. Kalilbaum (Berlin) supplies a special grade of H2SO4 "pro analysi acidi lactici". This acid can be easily replaced by ordinary chemically pure commercial acid, redistilling it and diluting it with water according to the prescription given above. Pure sulfuric acid should be stored in a bottle with a well-ground glass stopper and protected from dust. 2. According to Friedemann, Cotonio and Schaffer. Principle of the method. In the filtrate freed from proteins and carbohydrates, lactic acid is oxidized by a solution of potassium permanganate (KMnO4) in the presence of manganese sulfate to acetaldehyde, which is distilled off (by passing a stream of air) through a reflux condenser into a 1% solution of bisulfite, the excess of which is oxidized by iodine. The combination of aldehyde with bisulfite is decomposed by soda, after which the amount of liberated bisulfite is determined by iodometric titration. 2 gram-atoms of iodine correspond to one gram-molecule of lactic acid. Reagents: 1) approximately n/10 solution of KMnO4 (before use diluted 20 times with water); 2) solution of manganese sulfate: H2SO4 285 cm3, MnSO4 100 g, distilled water to 1,000 cm3; 3) 1% solution of sodium bisulfite (NaHSO3); 4) n/10 solution of iodine; 5) n/100 solution of iodine; 6) sodium bicarbonate in powder (NaHCO3); 7) 1% solution of starch in saturated solution of NaCl. In the filtrate of K. freed from proteins (F1), corresponding to 2 cm3 of K., carbohydrates are precipitated by adding 2 cm3 of 8% solution of CuSO4 and 1 g of calcium oxide hydrate, mixed and after 1/2 - 1 hour filtered. The determined part of the filtrate (F2) is placed in flask A of the distillation apparatus [fig. 17 (pp. 675-676)], 10 cm3 of MnSO4 solution (2) are added, brought with water to 60-75 cm3, talc is added for uniform boiling and the flask is connected to condenser B. The separatory funnel C is filled with n/10 solution of KMnO4 (1). Into receiver D 6 cm3 of bisulfite solution (3) and 10-15 cm3 of water are poured, all parts of the apparatus are connected, the water jet pump is started and heating of the contents of flask A is begun. When the liquid begins to boil, drop by drop, the KMnO4 solution is run from the separatory funnel until the beginning of precipitation of manganese peroxide. After completing the distillation of acetaldehyde, the column with beads E and receiver D are disconnected, the liquid from the column is allowed to flow into the receiver, the beads are rinsed with water and titration is begun. After adding a few drops of indicator (7) to the contents of the receiver, it is first titrated with n/10, then with n/100 solution of iodine until a pale blue color appears; now 0.3-0.5 g of NaHCO3 is added and the liberated bisulfite is titrated with n/100 solution of iodine (the number of cm3 of solution used in the last titration = a). The described method is also used to titrate the control liquid obtained by distilling only the reagents without the filtrate of K. (the number of cm3 of iodine solution used in the second titration = b). Calculation: the content of lactic acid in mg in the portion of filtrate (F2) taken for oxidation is equal to: (a-b) × n × 45 mg, where n is the normality of the iodine solution, 45 mg is the amount of lactic acid corresponding to 1 cm3 of normal iodine solution during titration. In addition to the mentioned methods for quantitative determination of various extractive substances of K., other methods have also been proposed. Pigments. Bilirubin (see Bile) belongs to the normal components of human and animal blood. The content of bilirubin in the blood of a given subject is very constant in normal conditions, but individually varies: from 0.25 mg% to 0.40 mg% according to the data of Hymans van den Bergh and up to 1 mg% according to the data of Forster. The concentration of bilirubin is often expressed in bilirubin units; one bilirubin unit is conventionally called the concentration of bilirubin corresponding to 0.5 mg of it in 100 cm3 of solvent. The serum of newborns contains more bilirubin: from 1 to 3 mg%. The limiting concentration of bilirubin in blood, above which bilirubinuria occurs, is approximately 2 mg%. An increase is observed in congestive and hemolytic jaundice, pernicious anemia, Banti's disease, weakness of the heart muscle. The content is decreased in kidney diseases, cancerous cachexia, tbc (see also Bilirubinemia). Determination according to Hymans van den Bergh. Reagents. 1) Diazoreagent №1: 5.0 g of sulfanilic acid are dissolved in 500 cm3 of water, 50 cm3 of HCl (sp. gr. 1.19) are added and brought to 1 liter with water. 2) Diazoreagent №2: 0.5% solution of sodium nitrite. 3) 10% solution of KCNS. 4) 0.1508 g of chemically pure iron ammonium alum are dissolved in approximately 25 cm3 of water, 50 cm3 of concentrated HCl are added and brought to 100 cm3 with water. To 10 cm3 of the obtained solution, 2.5 cm3 of concentrated HCl are added and brought to 250 cm3 with water. 5) Standard solution: into a separatory funnel are introduced 3 cm3 of solution (4), 3 cm3 of solution (3) and 12 cm3 of ether; the mixture is thoroughly shaken in the cooled funnel and, after allowing it to stand, the aqueous solution is carefully drained through the funnel stopcock. The color of the ether solution of iron thiocyanate corresponds to the color of a solution containing 0.5 mg of bilirubin in 100 cm3. Instead of the alum solution (4), a solution of cobalt nitrate (2%) can also be used. However, these standard solutions give shades different from that obtained in blood under the action of the diazoreagent. It is therefore better to use pure bilirubin for comparison. Procedure of determination. Into a centrifuge tube, 1 cm3 of clear serum without traces of hemolysis is introduced, 2 cm3 of 96% alcohol are added and centrifuged. Into a colorimeter vessel, 1 cm3 of the clear centrifugate is taken, 0.25 cm3 of a freshly prepared mixture of 10 cm3 of solution (1) and 0.2 cm3 of solution (2), 0.5 cm3 of alcohol are added and colorimetry is performed. To calculate the amount of bilirubin in 100 cm3 of serum, the formula 2.5 × H1/H2 mg is used; H2 - reading of the standard, H1 - reading of the test. Determination according to Herzfeld. A series of test tubes is taken. Into the first, 2 cm3 of serum is introduced, into the others 1 cm3 of water each; from the first, 1 cm3 of liquid is transferred to the second and mixed; from it, 1 cm3 of liquid is transferred to the third and so on. To all test tubes are added a few drops of Hammarsten's reagent (see Bile). A green coloring is obtained. The concentration of bilirubin in the last test tube containing still colored liquid corresponds to 0.0156 mg in 1 cm3. Example: the color is still noticeable in the test tube where the serum was diluted 4 times. The concentration of bilirubin in 100 cm3 of serum = 0.0156 × 4 × 100 = 6.24 mg. With this method, however, too high figures are obtained. Hemoglobin is normally not found in plasma; it passes into it in intoxications leading to intravascular hemolysis (hydrogen arsenide, nitrobenzene, aniline, Berthollet's salt, pyrogallic acid).
Only a significant increase in the content of Hb in the serum leads to hemoglobinuria, since small amounts are retained in the blood. - Hematoporphyrins are found in B. in pernicious anemia, acute anemia, acute yellow atrophy of the liver, eclampsia, malaria, lead poisoning; in normal conditions it is absent (see also Porphyrin). - Traces of methemoglobin were found in poisoning with amyl nitrite and Berthollet's salt, aniline, nitrobenzene, pyrogallic acid. - Urobilin. Using Schlesinger's reagent (see Urine), some researchers found urobilin in normal serum, while others did not obtain positive reactions either in plasma or in serum. Urobilin is found in serum in lobar pneumonia, decompensated defects, cholelithiasis (Weltmann, Loewenstein). (See also Urobilin, methods of quantitative determination.) - For the detection of urobilinogen in serum, Ehrlich's aldehyde reaction was used, which gives a positive result in all cases of lobar pneumonia, cardiac insufficiency, acute inflammatory processes in the liver. But Adler and Hilgenfeldt established that the aldehyde reaction in serum is not specific for urobilinogen and should be attributed to the tryptophan group of serum proteins (see also Hemolysis in vivo, Nitrogen metabolism). - Lipochromes, pigments that give the serum a yellow color: lutein, xanthophyll, carotene. From the serum, these pigments are extracted with ether after preliminary treatment with alcohol. The content of lipochromes in B. depends on the type of diet; they are strictly EXOGENOUS substances.
S. Severin. Enzymes of B. A large number of different enzymes have been found in blood. Some of them are contained in the cells-erythrocytes and leukocytes, others are contained only in plasma, and still others are distributed both in the liquid part and in the formed elements of B. It is not possible to give an exact quantitative characterization of the content of individual enzymes for most of them, because in the absence of standard methods of quantitative accounting, the figures of individual authors are not comparable with each other. Therefore, in most cases, one can only speak about the qualitative aspect, about the presence or absence of a particular enzyme. As for quantitative changes, e.g. in certain pathological conditions, one can only judge on the basis of comparing studies carried out by the same methodology. The origin of the enzymes of B. is undoubtedly very different. Partly they are endoenzymes (e.g. the glycolytic enzyme), partly they enter the plasma of B. either during the breakdown of blood cells or from various organs and tissues, and partly they may be absorbed back into B. from the digestive tract (Boldyrev). Their biological role remains little clarified, and it is difficult to say what role they play in the general processes of metabolism. It is very possible that certain changes in their content have so much independent significance as they are a reflection of the general state of the organism, and in this respect their determination at times can have considerable importance. For enzymes participating in the clotting of B.--see below--blood clotting. Catalase was the first enzyme discovered in B. (Thenard; 1818). It is contained exclusively in the formed elements, in particular in erythrocytes. The opinion that it is associated with Hb can now be considered finally refuted. The figures for the quantitative content of catalase in B. can serve as an example of the incomparability of the results of individual researchers: 1 cm3 of blood, according to van Itali, decomposes 1.08 g of hydrogen peroxide, according to Batelli and Stern-14 g, according to Bach and Zubkova-18 g, according to Jolles and Oppenheim-23 g. Since catalase is mainly contained in erythrocytes, it is more appropriate to relate its quantity not to a certain volume of blood ('catalase number'), but to a certain number of erythrocytes (van Thienen) ('catalase index'), or to a certain volume of them (Bernstein). The activity of catalase can be partially inhibited by the anticatalase present in B. (Stern); the action of the latter can be eliminated by adding traces of ethyl alcohol. - Peroxidase in B. is apparently absent, its role is performed by hemoglobin. Oxidase can be detected only histochemically in some granules of white blood cells.- Amylase also belongs to the number of the most long-known enzymes of B. (Magendie; 1846). Its content is highest in the blood of dogs and pigs, in humans it is significantly lower. According to Wohlgemuth (see Wohlgemuth's method), the activity of amylase in human B. is expressed as d = 8-32, or W = 10-80, i.e. 1 cm3 in 30 min. cleaves 8-32 mg of starch until the iodine reaction disappears, or in 24 hours-1-8 g; according to Engelhardt and Gerkhuk, when amylase acts on starch, 1.85-5.85 g of reducing sugar is formed in 2 hours. The amylase of B. undoubtedly comes in large part from the pancreas: when the duct is ligated or obstructed (stones, tumors), the content of amylase in the blood sharply increases, also after the injection of pilocarpine; the latter is not observed after preliminary extirpation of the pancreas. The nature of nutrition does not noticeably affect amylase. Previous indications that after parenteral administration of starch the content of amylase in the blood increases have not been confirmed in later research. A review of the literature regarding changes in amylase in various diseases is given by Blok.-Of other enzymes acting on carbohydrates, one can mention maltase, which however is not found in all animal species. Invertase is not contained in B. in normal conditions. Abderhalden found it after the injection of cane sugar, which however is disputed by later researchers. The glycolytic enzyme, cleaving glucose with the formation of lactic acid, is contained exclusively in the formed elements (see Glycolysis).- Lipase (esterase) is contained both in plasma and in erythrocytes, in approximately equal amounts. The lipase of B. is inhibited by atoxyl (difference from pancreatic) and quinine (difference from liver lipase), insensitive to chloral hydrate (difference from adrenal lipase). By studying the relationship of B. lipase to the above substances, it can be found that in diseases of a particular organ, the lipase characteristic of this organ appears in B. This can also be used for diagnostic purposes. Attempts have been made several times to link the content of lipase in B. with the course of one or another tuberculous process, considering that this enzyme may play a role in the dissolution of the lipoid shell of tubercle bacilli; it has not yet been possible to come to any definite conclusion on the basis of conflicting data from individual researchers. The content of lipase in the blood sharply increases under the influence of chloroform. Ether anesthesia apparently does not have this effect. The question of the existence of proteolytic enzymes in B. has caused much controversy. Blood left to itself (most experiments refer to serum) usually does not show autolysis and even more so-it shows clear antitryptic action. However, autolysis begins if the serum is subjected to certain treatments (shaking with suspensions of starch, kaolin, agar-agar, extraction with chloroform, etc.). These results are interpreted as follows: in B. along with proteases there are antienzymes that inhibit their action. With the specified treatment, antienzymes are removed, and proteases begin to manifest their action unhindered. American authors attribute the antitryptic action to unsaturated fatty acids and their soaps, other researchers-to a special physicochemical state of serum proteins. In addition to antitryptic action, serum also has the property of inhibiting the action of the rennet enzyme. This ability increases after the parenteral administration of this enzyme ('anti-lab' of Korsun). According to Abderhalden, proteolytic (more precisely peptolytic) enzymes are also contained in erythrocytes (cleavage of glycyl-tyrosine). A special group of proteases consists of the enzymes described by Abderhalden, which appear after foreign proteins enter B. and specifically cleave just this protein. The detection of these enzymes, whose existence is now strongly disputed, is the basis of the so-called Abderhalden reaction (see). According to Utkin-Lyubovtsov, there are two proteases in B.: one with an optimum of action at pH = 7, the other at pH = 2.5-2.7.-The formation of ammonia in extravasated B. is due to the action of an enzyme contained in erythrocytes that deaminates aminopurines or their nucleotides and nucleosides (Engelhardt, Mosolovsky).- Phosphatase, which cleaves esters of phosphoric acid (glycerophosphates, hexosephosphates), is contained both in plasma and in corpuscles. In some diseases of the bone system, the content of this enzyme in B. can increase 20 times or more.
V. Engelhardt. X. Clotting of Blood. The clotting of Blood is the property of Blood to transform under certain conditions into a gelatinous mass—a blood clot—which consists of fibrin and blood cells captured by this clot. After some time the clot contracts (clot retraction) and squeezes out serum in the form of a clear, slightly yellowish liquid without admixture of blood cells. The clotting process reduces to the formation in Blood of a protein soluble in plasma—fibrinogen—and its transformation into insoluble fibrin. Macroscopically this reduces to gelatinization, but microscopically (or more precisely ultramicroscopically) separate needles appear, which connect into a dense network. When examined with an ultramicroscope, the process resembles crystallization, and some authors consider the clotting process as a crystallization process (Stiibel). Under normal conditions in vessels, blood does not clot, but when it leaves the vessels, clotting occurs. The resulting clot prevents further bleeding. The ability of Blood to clot should be considered as an adaptive function of the organism in the struggle for existence, in which traumatic injuries represent a common phenomenon. The study of clotting processes presents great difficulties. There is no single research methodology; one has to deal with substances whose nature has not yet been clarified, substances that are very unstable. The lack of a unified terminology also complicates matters; the same substance in different authors bears different names. Thus, the names of individual components of clotting appear in the following form. Fibrin in all authors bears one name; fibrinogen bears this name in most authors; fibrin-enzyme (A. Schmidt) = thrombin (Morawitz); pro-stage (zymogen) of fibrin-enzyme = thrombogen (Morawitz) = prothrombin (A. Schmidt) = plasmozyme = serozyme (Bordet, Morawitz); pro-stage of thrombogen = prothrombogen = proserozyme (Bordet); thrombokinase (Morawitz) = thrombozym + thromboplastic substance (Nolf) = cytozyme (Bordet) = lipid. Theory of Blood Clotting. The first studies on the clotting of Blood belong to Denis, Buchanan, Virchow (v. Denis, Buchanan, Virchow). Until 1905, the doctrine of blood clotting stood entirely on the point of view of the fermentative theory. Subsequently, under the influence of successes in colloid chemistry, attempts were made to explain the mechanism of clotting exclusively by physicochemical means, completely rejecting fermentative justifications. The basis of research in the field of Blood clotting is the classic theory of A. Schmidt, who considers the clotting of Blood as a fermentative process. This theory received further development through the works of Arthus, Pages, Hammarsten, who established the necessity of the presence of Ca salts for the clotting process; the works of Morawitz strengthened the prevailing and still current doctrine of the fermentative nature of the blood clotting process. Fuld and Spiro joined his views. This still prevailing theory considers the clotting of Blood as a fermentative process. According to this theory, fibrin is an enzyme (thrombin) that is present in Blood not as such, but in the form of an inactive proenzyme thrombogen. For the activation of thrombogen, two factors are necessary: 1) calcium salts, 2) coenzyme-activator, named by Morawitz thrombokinase. According to Morawitz, for the clotting process the following components are necessary: 1) fibrinogen, 2) thrombogen, 3) calcium salts and 4) thrombokinase. Supporters of the fermentative theory distinguish in the clotting process 2 phases: 1st phase—formation of fibrin-enzyme (thrombin) from its pro-stage; 2nd phase—transformation of fibrinogen under the influence of thrombin into insoluble fibrin. The formation of thrombin represents a complex process in which many factors participate. For the formation of thrombin from thrombogen present in plasma, the action of thrombokinase (formed mainly during the breakdown of blood platelets) is necessary, which converts thrombogen into prothrombin, which in the presence of Ca ions passes into α-prothrombin. The latter under the influence of zimoplastic substances formed during the breakdown of cells, provided the corresponding active reaction of the medium, gives thrombin. When Blood leaves the vessels, damage to the cellular elements of blood occurs, thrombokinase is formed. In the interaction of thrombokinase (zimoplastic substances), thrombogen and calcium ions, active thrombin is formed, under the influence of which the transition of fibrinogen into fibrin occurs. The presence of calcium salts is not directly necessary for the transition of fibrinogen into fibrin. Inside vessels, blood does not clot, because there is no thrombokinase. The amount of thrombokinase formed in circulating Blood due to the breakdown of cellular elements is so insignificant that it cannot affect clotting, because its action is neutralized by the presence in Blood of substances that prevent clotting. In addition, the action of thrombin formed in circulating blood does not manifest itself due to the presence in blood of antithrombin. To prove the fermentative nature of thrombin, Schmidt cites a number of properties that bring thrombin closer to enzymes: 1) thrombin, like other enzymes, has an optimal action temperature (37°) and is destroyed at 70-75°; 2) its action weakens upon cooling; 3) minimal amounts are sufficient for its action to manifest; 4) acids and alkalis interfere, while neutral salts in weak concentrations promote its action; 5) it can be obtained free from proteins. Hammarsten and Oppenheimer classify thrombin as proteases, and according to Oppenheimer, its action resembles rennet. In more recent times, the question of Blood clotting has been considered from the point of view of colloid chemistry. According to this doctrine, clotting represents in the final result a colloid process. Fibrinogen is present in plasma in a colloidal solution. All processes that reduce dispersibility reduce the solubility of fibrinogen and lead to the appearance of insoluble fibrin. This theory was first put forward by Wooldridge5. He pointed out that thrombin is not the cause of Blood clotting, but its product. Nolf considers the clotting process as the mutual precipitation of three colloids present in Blood in labile equilibrium. The state of equilibrium is maintained due to the regulating influence of antithrombozyme. When equilibrium is disturbed, clotting occurs. Substances that promote clotting are called thromboplastic. In a broad sense, these include all objects that can disturb the unstable system: for example, glass dust, coal, walls of glass vessels, colloids of various degrees of dispersibility. Through thromboplastic substances, the antithrombotic influence is eliminated, and clotting occurs. Nolf notes that even in normal Blood, ultramicroscopically the appearance of fine fibrin threads is observed, but due to the proteolytic action of thrombozyme they quickly disappear. Thrombogen and thrombozyme act together on fibrinogen and create on the one hand fibrin, on the other thrombin. Depending on the amount of each of the three components participating in the clotting process, the results are different. In Blood where there is a lot of fibrinogen, only fibrin is formed, while in fluids where there is less fibrinogen than thrombogen, the unused thrombozyme and thrombogen, combining, form thrombin. Thus, according to Nolf's theory, thrombin is not the cause of clotting, as supporters of the fermentative theory assume, but a by-product as a result of clotting. Hekma considers fibrinogen as a soluble alkaline compound of fibrin. According to him, fibrin is a reversible gel of fibrinogen, and fibrinogen is the sol of fibrin. The basis of the process lies in the phenomena of hydration and dehydration. The clotting action of thrombin is based on its ability to adsorb alkalis. Thus Hekma gives this complex process a simple colloid-chemical explanation; there is no place for an enzyme. However, this could not be proven by experimental observations. Subsequently, Hekma changed his view on the mechanism of thrombin's action and believed that clotting under the influence of thrombin occurs due to its ability to cause agglutination of fibrinogen particles; Hekma began to consider thrombin as an agglutinin. But the clotting process cannot be compared with the agglutination process, which manifests its specific coagulating properties not by agglutination, but by another means. Zak emphasized the importance of lipids of Blood for its clotting. Defatted plasma does not have the ability to clot even in the presence of ready-made thrombin; the addition of lipid-containing substances restores its ability to clot. Zak's lipids are identified with kinase. If we set aside Nolf's theory, which defends quite special views, then all authors agree that the process of blood clotting consists in the transformation of the soluble protein body in plasma—fibrinogen—into insoluble fibrin under the influence of thrombin.
As for the character and essence of thrombin's influence, the views of different authors sharply diverge, and the question cannot currently be considered definitively resolved. Recently, a new theory of clotting has appeared, explaining this process from a completely new point of view. Stuber and Lang point out that during clotting, sugar disappears from the blood and lactic acid forms, which they consider the cause of clotting. They believe that the basis of the clotting process is not a specifically clotting, but a glycolytic enzyme, and its action is not direct. The precipitation of fibrin occurs along the path of glycolysis. The faster lactic acid forms, the faster clotting occurs. - As for the place of formation of substances necessary for clotting (fibrinogen, thrombogen, and thrombokinase), there is also no unanimity of views. Some authors consider the bone marrow to be the place of formation of fibrinogen (J. Müller, Morawitz), others consider the liver. There are indications that fibrinogen forms in almost all organs and tissues. Recent works by American authors indicate a connection between the function of the reticuloendothelial system and the amount of fibrinogen in the blood. Thrombogen forms in the bone marrow from the formed elements of blood, primarily from blood platelets; thrombokinase also forms from them. As some believe, antithrombin and thrombin form in the liver, others dispute this. We know very little about the origin and chemical nature of prothrombin. The process of the transition of prothrombin into thrombin currently also remains unexplained. The determination of the clotting speed of blood can be performed with both venous and capillary blood. The former gives more accurate data, as it excludes the admixture of tissue fluid, which strongly affects the clotting process. But since a vein puncture is an obstacle for frequent research, in practice capillary blood is more often used for research. - Determination by Burker. In a depression of a slide, a drop of boiled (to remove CO2) distilled water is placed, and a drop of blood, obtained by pricking a well-washed fingertip, is also released into it. The moment of blood collection is marked on the clock. After 1/2 minute, a thin glass rod with a small ball at the end is introduced into the drop, and after making several (5) spiral movements, the rod is removed, capturing some of the blood. This is repeated every 1/2 minute until when the rod is removed from the blood, the first thread of fibrin appears, which is considered the beginning of clotting. The blood of a healthy person, when examined by this method, clots in 5-6 minutes. The research is conducted in a special apparatus that allows for research at a constant temperature. The apparatus consists of a water bath, which is filled with water at 25°. In the center of the cover there is a depression lined with metal; into this depression a slide with the blood being tested is inserted. Due to the fact that the glass lies on metal, a good heat conductor in contact with water, the research occurs at the same temperature. - Determination of clotting ability by Mas and Magro. A prick into the thoroughly washed flesh of the finger, the first drop is removed and a new drop is drawn into a capillary tube with a capacity of 20 mm3 (a pipette attached to Salix's hemometer), previously moistened inside with paraffin oil. The drop of blood is blown out into a paraffin drop placed on a small slide, also moistened with paraffin oil. This moment is marked as the beginning of the research. Every two minutes, the released drop of blood is drawn back into the pipette. Before clotting begins, the blood is drawn in easily; after clotting occurs, it cannot be drawn in. In normal conditions with this method, the blood clots in 8-12 minutes. - Determination by Fonio consists of measuring the blood's ability to overcome the action of substances that interfere with clotting. As substances inhibiting clotting, the author uses solutions of magnesium sulfate of different concentrations: 0.5; 1.0; 1.5; 2.0; 2.5; 3.0; 3.5; 4.0; 4.5%. Blood is taken from the elbow vein and mixed with a 0.75% solution of magnesium sulfate in a ratio of 3:1 (8 cm3 of blood and 2 cm3 of salt solution). A series of small test tubes (3-4 cm in height and 1 cm in diameter) are set up in a stand, and 0.2 cm3 of the blood mixture and 0.05 cm3 of the magnesium sulfate solution in gradually increasing concentration are measured into each. The first blood mixture remains in the first test tube. The stand is covered to protect from dust and left for 2 hours at room temperature, after which clotting is noted. In the first test tube, the clot is absolutely dense; the test tube in which clotting is incomplete and the one in which there are only individual clots are noted. To determine a violation of clotting, it is necessary to test the solutions on several samples of normal blood. - In the USSR, the most widespread method for researching clotting is the Sitkovsky method using coagulometers, which are various modifications of the instrument he proposed (Egorov). With the help of this apparatus, it is possible to conduct research at the same temperature. The apparatus consists of a glass vessel into which water is poured, heated by an alcohol lamp to a certain temperature. Through holes in the cork, a thermometer and a test tube are inserted into the vessel. The test tube is connected to a manometer by a side branch with a rubber tube. The manometer is connected on the other side with a rubber tube to a rubber bulb. Blood, obtained by pricking a thoroughly washed fingertip, is drawn into a capillary to a certain mark (1-2 cm in height), the moment of blood collection is marked on the clock; the capillary with blood is inserted through a rubber stopper into a test tube immersed in a vessel with water. The water is preheated to body temperature and maintained at this temperature throughout. By pressing the rubber bulb with a screw, air is forced into the test tube into which the capillary with blood is immersed. The increased pressure, indicated on the manometer, raises the column of blood in the capillary, and it moves up and down. Until clotting occurs, the walls of the capillaries remain clean. By pressing the bulb every 1/2 minutes to cause movement of the blood column in the capillary, the moment when pieces of blood adhere to the vessel walls is noted as the beginning of clotting. The end of clotting is considered the moment when, at a pressure of 30 mm of mercury, the blood column remains motionless. In normal blood, the beginning of clotting by this method occurs after 1.5-2 minutes, the end after 2-4 minutes. - Changes in blood clotting under the influence of various conditions. The clotting ability of blood in a normal healthy person changes depending on a number of conditions. Thus, the clotting time of blood shortens after eating (Mills). Temperature strongly affects the speed of clotting. Low temperature in warm-blooded animals slows down, in cold-blooded animals accelerates blood clotting. The optimal temperature for clotting in warm-blooded animals is body temperature. A number of physiological factors affect clotting: metabolism, functions of the endocrine apparatus, conditions of isotonicity, isoionia, etc. Ions of calcium have enormous significance in the clotting process. There are indications that divalent cations mainly affect the formation of thrombin, promoting it in weak concentrations and delaying it in strong ones; anions delay clotting. The state of reserve alkalinity also affects clotting ability. Baumberger indicated that with an increase in bicarbonates, blood clotting slows down, and with an increase in CO2 tension in the blood, clotting accelerates. The reaction of the medium also affects clotting: an acidic reaction promotes clotting, while an alkaline one hinders it; small doses of adrenaline (0.001 mg per 1 kg of weight) accelerate clotting, while large doses slow it down. Extracts of the pituitary gland (posterior and anterior lobes) act differently on clotting: extracts of the posterior part accelerate clotting, of the anterior part slow it down. When feeding rabbits thyroid gland, a slowing of clotting is obtained (Schiakawo, Sasaki). When ligating the excretory ducts of the pancreas, an increase in fibrinogen content in the blood and simultaneously a slowing of blood clotting occurs. Under the influence of ultraviolet rays, blood clotting in vitro slows down. Data on the effect of ultraviolet rays in vivo are contradictory. Observations by Stephan have established that upon X-ray irradiation of the spleen, the blood's ability to clot significantly increases. Based on these data, Stephan assigns the spleen a central role in regulating the clotting mechanism. Pointing to the favorable therapeutic effect obtained from X-ray irradiation of the spleen in pathological changes in clotting, Stuber disputes the spleen's participation in the physiological process of blood clotting. Taking into account the fact of accelerated blood clotting upon X-ray irradiation of the spleen, some authors recommend preventive X-ray irradiation of the spleen in complex operations accompanied by dangerous bleeding. There are indications of a connection between blood clotting and the problem of immunity. Fuchs and Falkenhausen point out the identity of prothrombin with complement.
They note that all anti-thrombic substances that slow coagulation simultaneously slow the action of complement; this is indirectly confirmed by the fact that complement can be replaced by prothrombin and vice versa. Plasma from which prothrombin has been removed possesses neither coagulability nor complement. Both return if prothrombin is added. Lunz and la Wachte report important data on the physiological peculiarities of coagulation in anaphylactic shock. Rapidly, soon after injection, there develops a significant slowing of blood coagulation. Kreys and Strausser found that the phase of decreased coagulability is preceded by a phase of increased coagulability. It is not possible at present to explain the cause of changes in coagulation of K. in anaphylaxis. Coagulation of K. in pathological conditions. Coagulation of K. in normal conditions is subject to small fluctuations. In adults (when determined by the Sitkovsky method) the beginning of coagulation varies from 1 to 1.5 minutes, and the end-between 2 and 4 minutes. In children coagulation of K. is the same as in adults; an exception is newborns, in whom during the first week of life coagulation is found to be decreased: beginning 3-4 minutes, end-up to 30 minutes and more (Gornitskaya). Under various pathological conditions there occur cases in which K. has an increased ability to coagulate, and then thrombus formation is observed; in other cases with decreased coagulability, severe bleeding is observed. More often in pathology there are diseases accompanied by slowing of coagulation. Among the group of diseases accompanied by hemorrhages, hemophilia (see) and pseudohemophilia should be placed first. A marked slowing of coagulation is a distinguishing feature of these diseases from the group of hemorrhagic diathesis, in which coagulation is usually not changed. If in hemophilia a marked slowing of coagulation is noted, pseudohemophilia is distinguished by the fact that in it coagulation of blood does not occur at all even after adding fresh serum, tissue extract, etc. The same blood, added to a fibrinogen solution, causes coagulation. In the plasma of K. of patients with pseudohemophilia, fibrinogen cannot be detected; thrombin, however, is formed in K., as indicated by the coagulation of the fibrinogen solution after adding pseudohemophilic blood serum. On the change in coagulation of K. - see Hemophilia. - In the group of diseases known as hemorrhagic diathesis, in the vast majority of cases coagulation of K. is unchanged. Coagulation of K. is slowed in a number of infectious diseases: in measles and scarlet fever in children, in serum disease, erythema nodosum (Gornitskaya); Murakami and Yamaguchi found in tuberculosis and pleuritis an increase in fibrinogen and a decrease in fibrin-ferment, causing slowing of coagulation. Slowing of coagulation was found in malignant tumors (Allen, Gornitskaya). In hyperthyroidism coagulation is slowed, and in hypothyroidism-accelerated. In diabetes mellitus coagulation is slowed (Zukershtein, Gornitskaya). The hemorrhages observed in cholemias and the noted slowing of coagulation in them some authors explain by a deficiency of fibrinogen; others believe that here, similar to hemophilia, there is a slow formation of thrombin. Hartmann explains the slowing of coagulation in parenchymal liver lesions by the appearance in K. of a large amount of substances preventing the transformation of proserozin (prothrombogen) into serozin (thrombogen). There are also indications of disturbances in the formation of fibrin and thrombin. Conditions slowing coagulation of K. A deficiency of components necessary for coagulation or inhibition of one of the phases of coagulation cause slowing or complete arrest of coagulation. Such coagulation-inhibiting factors can include a decrease in temperature, precipitation of calcium, extraction of lipoids, addition of gum, protein, hirudin, heparin. To substances slowing coagulation also belong certain alkaloids: atropine, pilocarpine, strychnine, choline, quinine, nicotine, cocaine, etc. It turns out that substances with antagonistic pharmacological action have the same effect on coagulation. To substances slowing coagulation should be attributed bile, chloroform, alcohol, ether, chloral hydrate, salvarsan, veronal, formaldehyde, and others. The action of these substances on coagulation is explained differently: thus, the slowing of coagulation caused by chloroform, ether, chloral hydrate anesthesia is explained by the action of these substances on the liver. The action of choline is explained by the fact that it prevents the transformation of proserozin into serozin; formaldehyde-by the destruction of fibrinogen and thrombin, etc. Substances accelerating coagulation. Hypertonic salt solutions accelerate coagulation. Their action is explained by the hydremia that occurs after their introduction, which promotes the entry into the bloodstream of tissue substances that accelerate coagulation. There are indications that the oral administration of calcium accelerates coagulation; however, many deny this. Elving with his research proved that the intravenous administration of a hypertonic solution of calcium chloride is the most effective means of accelerating coagulation. The action of gelatin in coagulation may be due to the action of a calcium impurity. Large doses of sodium citrate, administered intravenously, cause acceleration of coagulation. The effect is explained by the action of this salt on the plates, which under its influence are rapidly destroyed, and citozim enters the plasma; in patients with purpura with a reduced number of plates and in ducks deprived of plates, no effect from the action of sodium citrate is observed. The accelerating action in vivo on blood coagulation is exerted by aephylline, piperazine, theophylline, etc.
E. Gornitskaya. XI. Respiration of the formed elements of Blood. If oxygen-saturated citrated blood is divided into two portions, and one is placed on ice while the other is put in a thermostat without access to air, then after several hours it can be noticed that the first portion retains its original bright red color, while the second darkens to some extent. The cause of this is the reduction of oxyhemoglobin in Hb due to the consumption of part of the O2 by the formed elements of Blood: erythrocytes, leukocytes, and blood platelets; this amount can be accurately measured and in a healthy person reaches 10% of the original amount of O2 in 5 hours. If the same experiment is performed with defibrinated normal blood, in which there are no platelets at all and the number of leukocytes is significantly reduced, then the loss of O2 drops to 3-4% in 5 hours (0.6-6.8 Vol %). Of this amount, about 0.1 Vol% falls to leukocytes per 1,000; after subtracting the oxygen consumed by them, 0.2-0.4 Vol % of O2 (1-2% of the original amount) remains, representing the consumption of O2 by erythrocytes of a healthy person (the so-called reduced figure). This figure often drops to zero, but generally lies almost within the limits of research error, so one can only speak very conditionally about the consumption of O2 by normal human erythrocytes. The consumption of O2 is significantly greater in dogs—7-14%, according to Denecke, and in rabbits—about 15%, according to Warburg; goose blood (nucleated erythrocytes) can lose up to 60% of its oxygen in the first hour alone (Warburg). But in humans too, the oxygen consumption by erythrocytes can be sharply increased: this phenomenon is observed in anemic conditions of various origins, where oxygen consumption reaches 20-40 percent or more. The consumption of O2 by erythrocytes was first discovered by Morawitz and Pratt in 1908; simultaneously it was established that the disappearance of O2 is accompanied by the formation of a corresponding amount of CO2 (Morawitz, Warburg), and in 1923 Denecke also revealed the simultaneously occurring process of glycolysis, and all these phenomena take place not only in the presence of blood serum, but also in washed erythrocytes suspended in salt solutions (Warburg, Denecke). Thus, the consumption of O2 turns out to be a manifestation of the true respiratory process in the erythrocytes themselves. Since mature erythrocytes of healthy people consume almost no O2, but in the experiment a significant increase in O2 consumption is observed after bloodletting and an even greater one when hemolytic poisons are introduced, which cause the destruction of erythrocytes, accompanied, as is known, by particularly intense regeneration of Blood, Morawitz, already in his first works on this subject, concluded that the consumption of O2 depends on the 'young' erythrocytes circulating in the Blood, which differ from fully mature ones by a clearly expressed respiratory exchange. On this basis, he then proposed to use this method to determine the intensity of Blood regeneration. Later, all other researchers in this field also adhered to this point of view. As for which erythrocytes have enhanced respiration, it was clear from the very beginning that these are not only nucleated bodies, which may even be completely absent when O2 absorption by the blood is enhanced; enhanced respiration is obviously associated with morphologically indistinguishable remnants of nuclear substance that have not yet completely dissolved. These substances were detected by Masing by determining nuclein-phosphorus in young erythrocytes. On the other hand, a certain role is undoubtedly played by the more complex structure of the protoplasm of immature bodies (see Tissue respiration), the manifestation of which is the reticulo-filamentous substance. However, changes in both of these factors of the respiratory process (nuclear substance and protoplasmic structure) do not always proceed completely parallel to each other; as a result of this, some researchers note the absence of parallelism between O2 consumption, which depends mainly on the state of the nuclear substance, and other morphological or physicochemical signs of erythrocyte immaturity, which depend on the state of the protoplasm (polychromasia, vital staining). For the same reason, none of these signs can completely replace the determination of the degree of O2 consumption by erythrocytes. Unfortunately, the rather tedious research technique hinders its introduction into clinical practice. Research technique. 10-15 cm3 of Blood is drawn from the cubital vein into a vessel containing glass beads. By careful shaking, the Blood is defibrinated; by filtration from it, all clots and a significant part of leukocytes are removed. The defibrinated blood is filtered through sterile gauze into an Erlenmeyer flask and saturated with oxygen by careful shaking in the air for 15 minutes, after which part of it is poured into a flask with a glass bead, tightly closed with a ground stopper (make sure no air bubble remains in the flask) and placed for 5 hours in a thermostat at 38°. After this time, by repeatedly carefully inverting the flask, an even distribution of the settled erythrocytes is achieved, the flask is opened, 1 cm3 of Blood is quickly taken from its bottom and placed under a hemolyzing solution (0.5% ammonia solution with traces of saponin) in a special vessel from the Barcroft-Goldman apparatus. From the blood not placed in the thermostat, 1 cm3 is hemolyzed in the same way immediately after O2 saturation. The determination of O2 is performed with potassium ferrocyanide according to Barcroft-Goldman. The difference between the O2 content in both portions of Blood shows the amount consumed, from which is then subtracted the consumption attributable to leukocytes (do not forget to count the leukocytes in the defibrinated blood!). The calculation is performed as follows: in the saturated Blood, 0.185 cm3 of O2 was found, in the one taken from the thermostat—0.167 cm3 of O2, leukocytes in 1 mm3 of defibrinated Blood—4,000. The O2 consumption by erythrocytes is equal to: 0.185-0.167-0.004 (leukocytes) = 0.014 cm3 = 7.6%. An essential condition for the accuracy of the results is the sterility of the apparatus (bacterial respiration) and complete hemolysis of the Blood in the apparatus.
Ya. Chernyak.
XII. Pathology of Blood. Diseases of the blood in the literal sense of this word apparently do not exist, since in all cases classified as diseases of Blood, the blood-forming organs always participate in one form or another; therefore, it is more correct to speak not of diseases of Blood, but of diseases of Blood and blood-forming organs. However, in resolving the question of the mechanism of development of these diseases, controversial questions still arise to this day—what processes (in the blood or in the blood-forming organs) are primary and what are secondary, since by introducing changes into the composition of Blood, we usually also get changes in the blood-forming organs, and conversely, changes in the latter usually give one or another 'pictures of blood'. Thus, hemopathies and myelopathies (adenopathies) are closely coordinated processes. From this, of course, it does not follow that the detection of certain pathological changes in Blood always indicates corresponding pictures in the bone marrow (or in the lymph glands), and conversely, that changes in the blood-forming organs always correspond to certain pictures of blood. (For possible causes of such discrepancy, see above, as well as Hematopoiesis.) Clinical and morphological research on diseases of Blood further shows that even this broader interpretation of diseases of Blood needs corrections in the sense of further expansion of the morphological and functional basis of these diseases. Thus, in some diseases of Blood, the blood and lymphatic systems lying outside the blood-forming organs are drawn into the pathological process, often the connective tissue in general is drawn in, wherever it may be. Sometimes— the picture of diseases of Blood and blood-forming organs is supplemented by disorders of other systems, e.g., the digestive tract, nervous system (e.g., malignant anemia), and here difficulties arise also regarding the question of the pathogenesis of the disease in the sense that many tried to assign primary importance to changes in exactly these systems. Finally, in a number of cases, there is no doubt that 'diseases of the blood' are a reflection of diseases of other systems of the body (metastasis of cancer into the bone system, infectious leukocytoses and myeloses, leukemoid reactions in various conditions, etc.). Diseases of blood usually include the following diseases: Anemia, Leukemia, Lymphogranulomatosis, Polycythemia, Agranulocytosis, Aleukia, Hemophilia, Hemolytic jaundice, Werlhoff's disease, Lymphosarcoma, Myeloma (SM.).
I. Davydovsky. XIII. Blood of children. Human blood exhibits periodic variability in its physical properties and chemical composition. These changes depend on various external and internal factors. One such factor is the age of the person, as the metabolism, physicochemical properties of cells, and anatomo-physiological constants of the organism show rather significant differences in separate age periods. The most distinct difference in the structure and function of the organism in general, and in the physicochemical properties of blood in particular, is observed in infants, i.e., up to 1 year of age (see Infant). This period of human life is characterized by peculiarities of nutrition, metabolism, and the activity of regulatory organs, particularly the endocrine system. Here, the marked lability of water exchange, the intensity of processes of assimilation and cell multiplication, and the relative insufficiency of enzymatic-oxidative functions come to the forefront. In connection with this, one must consider the larger volume of hematopoietic tissue in infants (red bone marrow of tubular bones, extramedullary foci of hematopoiesis) and more pronounced fluctuations in the tone of blood vessels. The latter can be in children a cause of more significant differences in the composition of blood in different areas of the body than in adults. In later age periods, the influence of age recedes to the background, and other factors begin to gradually exert a greater influence on the properties of blood, such as: the individuality of the child in terms of constitution and environmental conditions. However, taking into account the regularity of changes in the properties of blood in connection with the nature of metabolism in the body and knowing the peculiarities of metabolism for separate age groups, it is possible to establish in each specific case the dependence of the found values on the age of the child. Physical properties of children's blood. The specific gravity of blood in the period from birth to 1 year is higher than in adults, equaling 1.060-1.070; in the 2nd year the specific gravity falls and thereafter remains at figures of 1.055-1.050. A higher specific gravity of blood is noted in boys. The viscosity of children's blood is significantly higher than in adults: after birth - 10.6-11.4, at the beginning of the 2nd month - 6.3, and up to 1 year the average figure is considered 3.8. The coagulability of blood in newborns is increased during the first week of life compared to adults by 2-3 times; subsequently, starting from the 2nd week, the difference rapidly disappears, and the coagulability of blood changes little even during diseases. An exception is measles, which during incubation gives a sharp decrease in coagulability. The coagulability of blood in premature infants is markedly slowed, reaching in the first week 30 min. (by the Sitkovsky-Yegorov method), and then rising by the end of the 2nd week to 1-2 min. (beginning) and 3-4 min. (end of coagulation) (Samsonova). According to Melent'eva's data, the coagulability of blood in healthy children up to 1 year is measured as 45-55 sec. (beginning) and 2 min. 10 sec.-2 min. 12 sec. (end). The erythrocyte sedimentation reaction (S.R.) in newborns up to 8 days is slowed, giving from 0 to 0.5 mm in 1 hour; thereafter the rate of sedimentation sharply increases to 14 mm, and then establishes at an average figure of 5-6.5 mm with fluctuations from 2 to 11 mm (according to Balakhovsky). The latter depend on food intake, and a sharp acceleration of the reaction is observed in children during acute infections and after subcutaneous administration of proteins. - The freezing point of blood serum is somewhat lower in infants than in adults, as intensive nutrition and metabolism lead to an increase in the molecular concentration of blood. For adults the values of Δ are limited to -0.54 to -0.59, but for small children the fluctuations of Δ exceed these limits in the direction of increase. - The total amount of blood in infants is greater than in adults, constituting about 1/10 of body weight, whereas in adults we have 1/13 of body weight. Chemical composition of children's blood. The active reaction of children's blood does not differ from that of adults; pH = 7.30-7.33 (at 40 mm CO2, according to Friedrichsen). Fluctuations in pH in blood serum are observed in healthy children within limits of 0.2-0.4 depending on nutrition; in infants the smallest fluctuations are given by breast milk and carbohydrates, and the greatest deviation in the acid direction is found when feeding with undiluted cow's milk; Cherni's mixture shifts the pH of infants' blood in the alkaline direction (Maslov). The normal state of acid-base equilibrium of blood is determined by pH equal on average to 7.31 at 38°, and by the content of CO2 in the blood equal to 50 vol%. Compensated acidosis of blood, i.e., an increase in CO2 at the same pH, is encountered in children under various conditions: 1) when feeding with inorganic acids; 2) in nephritis; 3) in diabetes; uncompensated acidosis of blood is found in anaphylactic shock, in acute intoxication, during coma. In tetany in children, an increase in the alkalinity of blood (alkalosis) has been established with an increase in pH by a small figure and with a significant decrease in the CO2 content in blood. - The dry residue of blood on the first day of life is 26% and falls on the 10th day to 23.07%. The ash content on the 1st day is 1.1%, on the 3rd day it falls to 0.97% and increases in the following 4 days to 1.07% and on the 10th day again falls to 0.98% (Schiff). The dry residue at night is higher than during the day; its amount in well-developed children is higher than in weak ones. - The proteins of human blood plasma constitute 6-8%; serum proteins - 7.42-9.13%; in newborns the lowest figure is noted, namely - about 6% protein substances in serum. The intake of solid food and the introduction of liquids have little effect on the total amount of blood proteins, whereas during muscular work it noticeably increases. Hypoalbuminosis is encountered in children in all hydremic states, for example, in kidney diseases, in prolonged cachexia, as well as in infectious diseases, due to retention of NaCl in the blood. The protein coefficient - the ratio of blood globulins to albumin for humans equals on average 1:1.5 (Adler, Strauss); in newborns significantly lower figures are found for globulins. A change in the coefficient (globulin:albumin) in the direction of an increase in globulins is observed in children in infectious diseases, in purulent processes, in tuberculosis, in kidney diseases, during immunization with vaccines and sera, during exposure to a quartz lamp. - The stability of plasma colloids is connected not with an increase in the total amount of globulins, but with an increase in coarsely dispersed proteins of this fraction; the plasma of newborns turns out to be the least stable despite the small content of globulins in it (Sachs, v. Ottingen). For judging the stability of plasma colloids, various reactions are used, based on evaluating the ease of precipitation of proteins from solution. Finkelstein's research by the Daranyi method showed that in infants the ease of precipitation of proteins from plasma increases in nutritional disorders and in tuberculosis. Residual nitrogen. The figure of residual nitrogen in infancy and childhood is elevated up to 50 mg%. At this the distribution of residual nitrogen is as follows: urea - 25 mg%, uric acid - 3.5 mg%, amino acids - 5.5 mg%, creatinine - 1.7 mg%, creatine - 6.5 mg%, ammonia 0.02-0.03 mg%. Thus the increase in residual nitrogen in infancy falls to the share of urea. In hypotrophy, exudative diathesis, and kidney diseases the value of residual nitrogen of blood becomes even higher. - The total amount of lipoids in children's blood undergoes more pronounced fluctuations than in adults, even under normal conditions. Here the frequency of food intake, the degree of mobility of the child, and the state of acid-base equilibrium of blood have an influence. The lability of all the mentioned conditions entails variability in the content of lipoids in children's blood. The largest number of works on lipoid metabolism in children is connected with the determination of the amount of cholesterol in blood. According to Rosenthal's data the figure of cholesterol in healthy infants on the first year fluctuates from 0.021 to 0.035 mg%; in children over 1 year it reaches 0.152 mg%; in premature infants, according to Ivanskaya - 0.047-0.055 mg%. According to Tur's research, regularities in the fluctuations of the cholesterol figure in children in different diseases could not be established. According to Sokolova's data, scarlatinal infection increases the amount of cholesterol in blood; at this high cholesterinemia may depend on the severity of the case or on the individuality of the child. In congenital syphilis cholesterol is 0.030-0.076 mg% (Rosenthal). - Sugar in children's blood under normal conditions fluctuates within the same limits as in adults: in infants according to the data of Fedynsky's clinic the average norm is between 0.06 and 0.11 mg%. Experiments with carbohydrate load (2.0 sucrose per 1 kg weight) and with subsequent determination of sugar content in blood during 2nd/3 hours every 15 minutes give in children different curves; at this for premature infants a curve with a very sharp rise and fall (steep curve) is characteristic. Under pathological conditions a shift in the direction of higher figures is given by children with so-called alimentary intoxication, with diseases of septic nature, and with jaundice (Fedynsky). Mineral substances of children's blood. The total amount of Ca in children's blood differs comparatively little from its value in the blood of adults.
For infants, the average figure for Ca is established at 10.2 mg%; in venous blood and during asphyxia it is somewhat higher; in the serum of healthy children Ca varies, according to Cramer and Tisdall, from 9.5 to 10 mg%, and according to Kotikov, from 8.5 to 14 mg%. Of greater clinical interest are the relationships of Ca to phosphorus in the blood and the potassium : calcium coefficient. Giorgi considers as normal such a ratio of calcium and phosphorus in the blood, in which the product Ca × P is greater than 40. According to the data of Zimbler and Neustadt, in healthy infants Ca varies from 9.6 to 11.6 mg%, and inorganic phosphorus from 3.75 to 5.0 mg%. In sick children, the variations of Ca are wider: from 5.0 to 15.0 mg%, and a phosphorus content below 3.5 mg% is considered characteristic of rickets (Zimbler and Begam). In tetany of infants, a decrease in the total amount of Ca in the serum of blood is found with a relatively high figure for inorganic phosphorus (Giorgi).- Potassium is contained in the blood of children in an amount of about 20 mg%, and the K : Ca coefficient varies from 1.70 to 2.15. An increase in the potassium content in the blood is observed in all processes accompanied by hemolysis, such as: anemias, certain infections, kidney insufficiency, anaphylactic shock. A decrease in potassium in the serum of blood has been noted under exposure to a quartz lamp (Adler).- The content of sodium and chlorides in the blood of children is somewhat elevated compared to adults.- The enzymes of children's blood show greater variations. In healthy infants, the catalase index by Bach's method is within the range of 14.0-18.0 g; protease (by Bach) is on average below 3 units, whereas in adults the protease index is 3-5.- Amylase in the blood of children gives very sharp variations from 300 to 600 units; lipase 20-26 units (Skvortsov, Melent'eva, Val'ter). Some authors see a connection between the strength of the enzymatic energy of children's blood and the biological completeness of the child's organism. Thus, according to the data of Pyurovskaya, the lowest blood enzyme indices are found in weak-born children; in premature infants, the enzymatic energy is less than in full-term ones. Variations in enzymatic energy are noted in children from day to day in connection with a drop or rise in weight. The clinical interest also lies in the ratio of the number of catalase to the number of erythrocytes and Hb (van Thienen). In children from 2 weeks to 3 years the index equals 2.0-5.5; the ratio =3.5-8.0 (Gryaznova and Melent'eva). erythrocytes hemoglobin catalase In adults the second index equals 5.4-6.8. According to Maslov, the differences in the enzymatic energy of children's blood depend on their constitutional properties. Thus, lymphatic-hypoplastics are distinguished by a decreased content of catalase, an increased content of lipase and amylase; in asthenics lipase and catalase are decreased (Maslov). Technique of taking blood in children-Here there are certain features in relation to infancy. For general clinical research and for biochemical micromethods, blood is taken from the heel or from the big toe of the foot, as this part of the body is easier to fix and besides all manipulations are less noticeable to the child. It is recommended to bring the child to the laboratory in a crib or else to take blood in the ward; it is necessary to note any violation of the normal course of taking blood, in order to take this into account when evaluating the results of the research (e.g. the child's cry). In cases where several cm3 of blood are required, it is collected gradually drop by drop from a puncture or incision of the heel, or one of the visible veins of the head or neck is punctured; finally, in infants blood can be taken from the longitudinal sinus, according to Tobler; the hair is shaved, the skin around the large fontanel is treated with iodine, a needle 21/2 cm long and 0.7-1.0 mm thick is inserted into the posterior angle of the large fontanel and it is guided parallel to the skin along the midline of the fontanel to a depth of 0.5-0.8 cm. N. Nikolaev. XIV. Parasites of Blood. Parasites of blood are localized in the plasma, erythrocytes, and leukocytes. In the blood plasma there are Trypanosoma gambiense, Trypanosoma rhodesiense, Trypanosoma Cruzi (during the period of life in the peripheral blood in the trypanosome stage) and merozoites of the malarial plasmodium (for a short time). Among flatworms, blood flukes (Schistosomum) live in the blood vessels; among tapeworms there are no inhabitants of the blood (if one does not consider the migration of embryos); among nematodes, the larvae of various filariae live in the blood plasma: microfilaria nocturna (Wuchereria Bancrofti), microfilaria diurna (Loa-loa), microfilaria perstans (Acanthocheilonema perstans). Embryos of trichinae, emerging from the intestine, reach the muscles through the bloodstream. In erythrocytes the cycle of schizogony (i.e. multiple division) of the malarial plasmodium takes place. The animal nature of the hemogregarins described in the erythrocytes of mammals and man is highly doubtful; they are apparently various plant cells contaminating blood smears during their preparation and staining. In mammals, the parasites of erythrocytes are piroplasms, babesiae, theileriae, anaplasmas, and bartonellas. In the erythrocytes of turtles, Haemogregarina Stepanowi lives and multiplies. Karyolysis lacertarum of lizards in erythrocytes passes through the gametocyte stages. Endoglobular parasites of leukocytes are leishmanias; in birds Leucocyto-zoon lives there; Toxoplasma in turn affects leukocytes (for example Toxoplasma Gondii). Hepatozoon muris spends part of its life cycle in the blood plasma and in mononuclears (gametocytes) of rats and mice; in leukocytes of the dog, rabbit, and various wild rodents, their own species of hemogregarins parasitize.
E. Pavlovsky.
XV. Blood as a nutrient medium. As a component of special nutrient media, blood creates particularly favorable conditions for cultivating certain microbes, and some species grow only on blood medium. Being thus selective, blood medium (agar) at the same time has a differential diagnostic character, as it serves as an indicator of the hemolytic ability of various bacteria, with the appearance of a zone of clearing around the colonies being the expression of hemolysis. Blood is taken from a human from the median vein of the arm, from large animals (horse, ram, sheep) from the jugular vein, and from laboratory animals (rabbits, guinea pigs) directly from the heart while observing all conditions of asepsis. If a large amount of blood is required for the medium, after thorough disinfection of the puncture site, the vein is punctured with a syringe or trocar, and the flowing blood is collected directly into a sterile, long-necked flask with beads; the flask must be constantly shaken to prevent clotting. After the procedure is completed, the collected blood is defibrinated by thorough shaking, after which it is ready for use. To prevent clotting, a 1/2% solution of sodium citrate can be used. In other cases, blood obtained from the aforementioned animals or from humans (from the pulp of the thumb according to Schottelius) is not defibrinated, but is added directly from the syringe to the nutrient medium (agar, broth). Taken sterile and defibrinated or especially mixed with a 1/2% solution of sodium citrate, blood can be well preserved on ice for several days. For preserving blood, some authors (Bernstein, Epstein, Cantani) recommend adding small amounts of ammonium oxalate, formaldehyde, or glycerin in equal volume to the blood (Cantani), but all these preservation methods have little practical importance. For preparing blood media, ordinary agar or broth is mainly used, sometimes with the addition of sugar, glycerin, etc. The agar is melted in a Koch apparatus, cooled to 45°, and 1 part of blood is added to 4-5 parts of it. By careful shaking to avoid bubble formation, the agar is mixed with the blood and poured into Petri dishes or into tubes as slant agar. For speed and simplicity, the surface of the slant agar can be coated with a few drops of fresh blood. Sometimes the medium is heated after adding blood, for example when preparing so-called chocolate agar by Levintal. Blood agar is mainly used for studying streptococci, anaerobes, and vibrios. According to Dold, for determining the hemolytic properties of streptococci, agar with the addition of 5-10% defibrinated blood of ram or horse should be used; the medium is poured into dishes in a rather thin layer. For obtaining surface growth of anaerobes, blood agar in Petri dishes is recommended. Agar Dieudonné is a selective medium for the growth of vibrios and especially cholera vibrios; blood is collected into sterile flasks with beads, mixed with an equal volume of normal caustic potash solution, and boiled for 45 minutes; in tightly closed bottles, the mixture can be preserved for several months. To seven parts of 3% neutral agar at 45°, three parts of the above-mentioned alkaline-blood mixture are added and poured into dishes. The dishes should be left at room temperature for 24-48 hours for the ammonia to evaporate, then they are dried in an incubator and inoculated. Colonies of vibrios are already visible after 10 hours, when there is as yet no growth of other bacteria of the intestinal flora. Pfeiffer and other authors find that hemoglobin can completely replace whole blood and is the most valuable part of it, making possible the growth of even such a capricious microbe as Bac. influenzae; Pfeiffer succeeded in obtaining a concentrated solution of hemoglobin from pigeon blood by treatment with 0.85% saline solution, successive freezing and thawing, or instead of the latter, treatment with ether followed by its evaporation in a vacuum at low temperature and filtration through a Chamberland candle. A drop of the resulting liquid, diluted with physiological solution and added to agar, makes it equivalent to blood agar. Blood media with different blood content from 10% to 70% are necessary for cultures of animal parasites; for this purpose, the Novy-Nicolle-Nguyen (N-N-N) medium is mainly used. Jessar proposed blood plasma as a nutrient medium, which is obtained by mixing blood with a 20% solution of sodium citrate and is a good medium for those studies in which the properties of the living organism and blood must be preserved unchanged. While on the one hand being a component of selective media, blood on the other hand can be used as a substitute for meat in nutrient broth. According to Szasz's method, the blood clot should be minced, poured with one and a half times the amount of distilled water, and left with frequent stirring for 24 hours; then filter through cloth, boil until flakes precipitate and the liquid becomes clear, establish the reaction, add peptone, salt, and proceed as in the preparation of broth. Langer recommends subjecting the blood clot to digestion at 37° with a solution of pancreatin and finds such a medium very favorable for the growth of microbes.
Related articles
Cite this page
“Blood.” Soviet Medical Encyclopedia. English translation of Bolshaya Meditsinskaya Entsiklopediya, 1st ed. (Moscow, 1928–1936), ed. N. A. Semashko. https://sovietmedicalencyclopedia.pages.dev/article/blood/