Graphic Images
Historical document, translated for reference. It reflects medical knowledge of the 1920s–30s and is not medical advice.
Summary
This article from the 1928–1936 Soviet medical encyclopedia explains the concept and uses of graphic images in medicine. It details various forms, including anatomical diagrams, charts for recording clinical data, and profiles for comparing individuals or groups. The text also covers the use of graphs for tracking physiological processes and the importance of proper design in medical graphics.
Encyclopedia article (1928–1936)
Graphic Images, of the South and East Crown.
Figure 2.
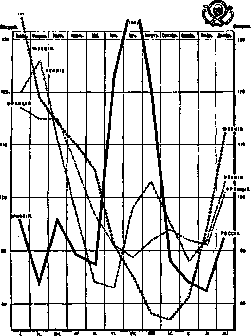
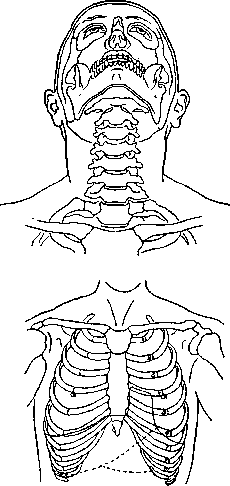
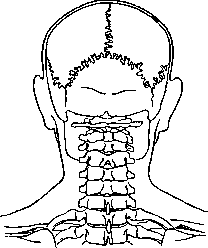
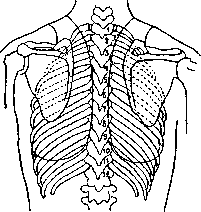
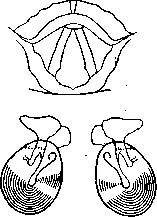
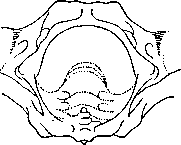
images of the human body (or its individual parts), for example, schemes of the anterior, posterior, or lateral surface of the body, schemes of the pelvis, etc., or conventional graphic images in the form, for example, of schemes of the visual field in ophthalmology (see Hemianopsia, vol. VI, art. 499-502), etc. On these schemes, the results of the investigation are marked with colored pencils or conventional signs, for example: the boundaries of absolute and relative dullness, the places of location of pathological respiratory noises, rales, changes in skin sensitivity (see vol. II, art. 109-111), etc. Similar schemes are used in the "personal sanitary-evacuation card of the victim of combat operations" for the possibility of more rapid clarification of the localization of the lesion. Similar Graphic Images are used for visual topographical designation of some locally applied physiotherapeutic measures, for example, for indicating the places of application of electrodes, etc. In biology and medicine, Graphic Images in the form of schemes are often used to clarify and reveal complex sometimes phenomena of heredity (see Hemophilia, vol. VI, art. 583-584). In addition to printed forms with various schemes, usually encountered in special medical institutions, rubber stamps are often used, by means of which various schemes of the arrangement of organs, etc., can be printed on any place of paper (see figure 4). Graphic Images are also body temperature curves and curves of various physiological processes (pulse, respiration, etc.), in the latter case Graphic Images are recorded by self-recording instruments (see Graphic method). For comparative characterization of individual objects and phenomena, as well as of individual individuals or collectives possessing diverse signs having diverse expression, in recent times in medicine Graphic Images in the form of profiles are widely used, giving the possibility of simultaneous expression of diverse signs. Thus, anthropometric profiles, psychological profiles, etc., are well known. An example of a profile can serve the psychophysiological profile shown in Fig. 3, applied in the RKKA for the characterization and comparative assessment of individual reinforcement groups: along the horizontal axis is the list of signs by which groups or individuals are compared, and along the vertical axis the different degree of development of individual signs in different groups or in different individuals is marked. As a result, a profile curve is obtained, sharply distinct for different groups or individuals.
Figure 4. Samples of graphic stamps for clinical purposes.
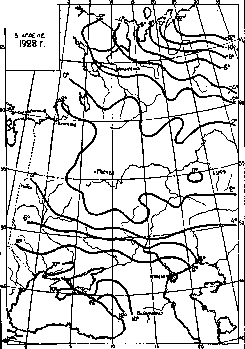
Among the forms of Graphic Images, acquaintance with which is necessary for a doctor, especially one in contact with resort business and climatology, sanitary doctor, etc., great significance belongs to the so-called "isotherms," or curves of constant value, for example, isotherms, i.e., imaginary lines connecting places with the same average temperature (see figure 6), isohypses (lines connecting places having the same height above sea level, which has enormous significance in the compilation and reading of topographic maps), isobars (imaginary lines connecting places having the same pressure), etc. Of course, what has been said does not exhaust all forms of Graphic Images. They are extremely diverse. The form of Graphic Images is closely connected with the character of the material. Therefore, "it is completely incorrect to entrust the compilation of projects for graphs of statistical data to non-specialists in medicine—draftsmen and draftsmen, since as a result of this, apart from incorrect methodology, soulless templates are created, which do not at all reflect in themselves the features of numerical series on which they arise. For this reason, only technical execution of projects, requiring not so much independent thinking as care and technical perfection, should be imposed on auxiliary personnel" (from the editor).
In the practice of medical-sanitary work in the USSR, the application of Graphic Images has received completely exceptional distribution, which is understandable if one takes into account the greatly raised interest in problems of public health, illumination of all medical questions in a social aspect, development of sanitary-propaganda work, etc. All this requires from every medical worker acquaintance with the technique of manufacturing graphic images.
Figure 5. Graph of movement of sanitary-transport means between a divisional hospital and a loading railway station.
Figure 6. Isotherms.
Related articles
Mentioned in
Cite this page
“Graphic Images.” Soviet Medical Encyclopedia. English translation of Bolshaya Meditsinskaya Entsiklopediya, 1st ed. (Moscow, 1928–1936), ed. N. A. Semashko. https://sovietmedicalencyclopedia.pages.dev/article/graphic-images/