Pulse
Historical document, translated for reference. It reflects medical knowledge of the 1920s–30s and is not medical advice.
Summary
The article provides a comprehensive historical and physiological overview of pulse, tracing its study from ancient Chinese and Greek medicine through modern developments. It explains the physical mechanisms of pulse waves, pulse volume, and pulse pressure, detailing how these relate to heart function and arterial elasticity.
Encyclopedia article (1928–1936)
PULSE, pulsus (Latin: push), is the rhythmic, wave-like movements of the vessel walls caused by the movement of blood ejected by the heart. The history of the study of pulse begins 2,639 years before our era, when the Chinese emperor Hoam-Tu and his court physician Li-Pe developed the doctrine of pulse. These researchers believed that the nature of the pulse wave could be used to diagnose, prognosticate, and treat any disease. They noted the dependence of pulse on sex, age, constitution, and diseases. For the next two millennia, there were no traces of the doctrine of pulse in medicine, and only 400 years before our era do we find, in the "father of medicine" Hippocrates, 9 basic classifications of pulse, most of which are still used today. Other famous physicians of antiquity (Praxagoras, Asclepiades, Erasistratus, Herophilus, Galen, etc.) also studied pulse, but added nothing new to the data of Hippocrates and the Chinese Hoam-Tu. Only the discovery of the circulation of blood by Harvey about 300 years ago put the study of pulse on the right path. However, further development proceeded slowly due to the lack of an instrument for recording pulse waves. The invention of the sphygmograph by Marey in 1832 greatly advanced the question, and the mirror capsules proposed by O. Frank in 1911 raised the study of pulse to its modern height. Arterial pulse. The phenomena of pulse from physical and clinical points of view. Contractions of the heart create two types of movement in the arterial system: 1) pulse waves and 2) the pulsating flow of blood (see Circulation), which should not be confused. Pulse waves consist of complex movements of individual blood particles having a dual character. They have: 1) a component in the direction perpendicular to the propagation of the wave (which corresponds to transverse oscillations), and 2) a component in the direction of wave propagation (corresponds to longitudinal oscillations). Since the blood contained in elastic arteries practically represents an ideal, incompressible, isotropic medium in which there can be neither periodic condensations nor rarefactions of the medium, its individual particles, changing their position, both in longitudinal and transverse oscillations, remain constantly at the same distances from each other. Therefore, not being able to produce periodic condensations and rarefactions in the blood, the transverse components of particle displacements create excess pressure on the wall and cause periodic expansions and contractions of the arterial tube, while the longitudinal component of particle displacements, changing the pressure in the liquid, moves the column of blood forward in the artery and stretches the artery along its axis. The second, i.e., the pulsating movement of blood forward, is maintained, on the one hand, by the pressure difference between the aorta and capillaries, and on the other hand, by the longitudinal displacements of particles in the pulse wave. This volume of blood with all the erythrocytes in it moves slowly, compared to the pulse wave, from one section of the artery to another. The pulse wave traveling along the arteries at high speed, overtaking the blood flow, as it were, pushes it from behind. These pulse waves and pulsating blood flow, as they move away from the heart, due to the ; elasticity of the arterial system and its division into branches, while simultaneously increasing the vascular bed and friction, inertia of mass, gradually fade toward the periphery. The pulse wave, moving to the periphery, decreases in amplitude of oscillation, almost without changing speed, while the blood flow becomes slower and slower. In normal conditions, in the capillaries, the blood flow is relatively slow and uniform. It is clear that with a normal rhythm, the number of pulse waves corresponds to the number of heart contractions. The heart rhythm, the amount of blood ejected with each systole (pulse volume), as well as the rate of pressure increase and its height (pulse pressure) are the most important factors determining the nature of the pulse. At the same time, one must always keep in mind the elasticity of the arterial walls. Pulse volume. Pulse volume (Volumpuls) is the amount of blood flowing through a given segment of the artery during each pulse period. Systolic filling of the aorta does not cause displacement of the entire column of blood in the arteries, as would be the case if the arterial system were not elastic but represented a system of rigid channels. Systolic waves propagate gradually from one end of the artery to the other, and in each given segment, the changes in volume and pressure over time and direction coincide with the changes in blood flow velocity. In addition, there is a continuous outflow of blood to the periphery, which, wave-like, sometimes accelerating (systole) sometimes slowing down (diastole), constantly reduces the filling of the arteries. During systole, the amount of blood passing through each cross-section of the artery has a maximum value, during diastole it has a minimum value. (The difference between the maximum systolic and minimum diastolic filling of a given artery determines the degree of "pulse filling.") Systolic filling of the artery corresponds to the clinical concept of the magnitude of pulse and coincides with the maximum systolic stretching of the arterial walls, which, due to the slight stretchability of the walls in cross-section, occurs mainly due to an increase in the length of the artery. In any study of pulse, one should take into account not only the pressure inside the artery, but also the force of resistance (elasticity) of the artery wall itself. Three stages of elasticity are distinguished. If the pressure of the external environment surrounding the artery is equal to the pressure inside the artery, then its walls are in equilibrium, the lumen is open, and the artery retains its zero form. Any increase in external pressure bends the walls inward, a decrease in it pushes the walls outward. With sufficiently high external pressure, the walls of the artery collapse, the lumen closes, and this position of the artery is called the 1st stage of elasticity. The 2nd stage of elasticity extends from the collapse of the walls to the complete opening of the lumen. Finally, the predominance of internal pressure over external increases the lumen of the artery as much as the resistance of the wall material allows, and transfers the artery to the 3rd stage of elasticity. In humans under normal conditions, all arteries are in the 3rd stage of elasticity. The resistance of an intact, filled artery consists of the pressure inside it and the resistance of the walls themselves. All existing methods for determining pulse volume are based on compressing a certain segment of the artery under a known pressure. In 1907, Sahli proposed a "volume meter" (Volumho-Jometer), which allows determining the systolic filling of a 5 cm long segment of the radial artery. For this purpose, a hollow rubber balloon is placed on the area of sulc. a. radialis, the pressure in which is increased to complete closure of the artery lumen at the end of diastole. Then, based on the amount of air displaced from the balloon, the magnitude of the pulse filling of this artery segment, obtained under the influence of cardiac systole, is determined. The inevitable outflow of blood in this case is of no importance. The second factor determining the quality of pulse is pulse pressure (Druckpuls). Pulse pressure is defined as the difference between the maximum pressure of blood on the arterial walls, which is achieved with each systolic filling of the arteries in a given location, and that minimum pressure to which the pressure in the artery falls between two pulse waves. Rhythmic increases in pressure in the arteries go hand in hand with an increase in volume, gradually propagating from one segment of the artery to another, to fade away on the periphery as branches separate and the cross-section of the vascular bed increases. The larger the pulse volume, the more strongly the arteries fill, the higher the pressure rises in them. However, most of the incoming blood immediately flows away to the periphery, and only a small part of it stretches the artery walls beyond their diastolic volume. In vessels with flexible walls (veins), an increase in blood volume can raise pressure. In arteries, the walls of which are to a greater or lesser extent supplied with muscular and elastic elements, stretchability is small and pressure increases are significant. The less the coefficient of elasticity of the artery, the higher the pressure rises in it with the same pulse volume. Thus, the blood pressure in the arteries constantly oscillates between the systolic maximum and diastolic minimum. Christen gives the following curve of changes in volume and pressure in an elastic artery (Fig. 1). On the abscissa axis, pressure changes are plotted; on the ordinate axis, volume changes. Roman numerals I, II, III mark the three phases of the curve corresponding to the three stages of elasticity: ъ - internal pressure, a-external pressure, va-artery volume,1 corresponding to its zero form.-Determination of pulse pressure-see Blood: pressure. The curve of changes in pulse pressure over time is called a sphygmogram.
. ! Frequency of P. The number of pulse waves in a normal person equals the number of heart contractions and averages 70 beats per minute in a healthy adult male in a standing position. Usually, the number of pulse waves is counted for 15-20-30 seconds and the resulting figure is multiplied by 4-3-2. With a poorly palpable pulse and irregular rhythm, and especially with atrial fibrillation, it is necessary to count for 1 minute or more. At the beginning of the examination, the pulse is always faster, and then as the patient calms down, the rhythm gradually slows down and only stabilizes at a constant minimum after 100 seconds. In normal conditions, under the influence of various physiological factors, the frequency of P. fluctuates within wide limits. These factors are as follows. Age-The most frequent P. occurs during intrauterine life and the first years, then until 25 years of age P. gradually slows down, from 25 to 60 years it remains within the same limits, and after 60 years it slightly accelerates again.-Muscular work. The more intense the muscular work, the more frequent the pulse. Nicolaï (Nicolaï) gives the following figures for a healthy person: in absolute rest-60 per 1', in ordinary conditions sitting-70 per 1', after prolonged walking-100 per 1', after long and fast walking-140 per 1', after fast running-150 per 1'. After muscular work in a healthy person, P. almost instantly slows down. The less work, the faster P. returns to normal. In a lying person, P. is on average 10 beats per 1' slower than in a standing position.-Sex. In women, P. is on average 5-10 beats per 1' faster than in men. Preyer (Preyer) notes the difference in these average figures even in intrauterine life: 2/3 of boys are born with P. below 135 per 1', and 1/3 above 135 per 1', while 2/3 of girls are born with P. above 145 per 1', and 1/3 below 145 per 1'.--Height. The taller the person, the slower the pulse in people of the same age. Volkmann gives the following formula for the connection between body length and pulse frequency: - = ^4^, where p and p1 are the average pulse frequency, and l and l1 are the body length. Rameau believes that - = According to Vierordt, with an increase in height of 0.1 m, the length of individual pulse periods increases by 0.03, i.e., by 1/20 of the average length of the pulse period. Temperature of the external environment. With an increase in temperature, the pulse frequency increases. After several minutes in a dry-air bath at 60°, the pulse accelerates to 160 per 1'. In a water bath at 40°, P. also accelerates to 160 per 1'. In the tropics, P. is faster, in middle latitudes slower. Nicolaï indicates that in winter P. is slower.-Time of day. The highest pulse frequency occurs from 8 to 11 hours in the morning (Budge). Then until 2 p.m. it gradually slows down. At 3 p.m. a new acceleration begins, which reaches its greatest magnitude at 6-8 p.m. In the middle of the night, during sleep, P. is the slowest. Sleep slows down P. by an average of 20 per 1'.-Food intake. Intake of large amounts of warm liquid accelerates the pulse. Cold drinks slow it down. Slow food and drink intake at room temperature do not affect the pulse. Lunch, heated to normal temperature, accelerates the pulse by 10-15 per 1'. The degree of acceleration depends on the environment, quality of food, and general condition of the patient. Pleasant and unpleasant taste sensations apparently do not affect P.-Psychological state. Strong emotions, such as fear, shame, anger, fright, disgust, accelerate P. Psychological perceptions that do not require attention strain slow down P., while forced attention fixation accelerates P. Strong physical pain accelerates P., while weak pain slows it down.-A number of pharmaceutical agents affect the frequency of P., either accelerating (caffeine, alcohol, atropine, adrenaline, etc.) or slowing down (digitalis, narcotics, etc.) it. For details, see individual drugs. Frequency of P. under the influence of pathological conditions. A. Acceleration of P., or tachycardia, occurs in: 1) febrile diseases, and with an increase in temperature of 1°, P. increases by an average of 8 beats per 1'. Exceptions are: a) typhoid fever (see Typhoid fever, clinical picture); b) tuberculous meningitis, in which despite high temperature, P. due to high intracranial pressure may be slowed down. On the contrary, in diphtheria and scarlet fever, we have an acceleration of P. of more than 8 beats per 1' per degree. 2) Acceleration of the pulse is observed in paralysis of the vagus nerve, which can be caused by atropine preparations, mechanical damage to the vagus centers (brain tumors, aneurysms of cerebral arteries, cerebral hemorrhage, etc.) or its trunk (tumors of the mediastinum, enlargement of bronchial glands, adhesions, etc.). 3) In Basedow's disease (see). 4) In cardiac weakness, when the weakened heart muscle compensates for the insufficiency in the amount of blood ejected with each systole by increasing the number of contractions. 5) In mitral stenosis and aortic insufficiency with signs of decompensation. 6) In a fall in blood pressure, both due to profuse bleeding and paralysis of the vasomotor centers of all vessels or of individual vessels. 7) The greatest accelerations of P. are observed during an attack of paroxysmal tachycardia (see). B. Slowing of P., or bradycardia. A slow pulse associated with a slow ventricular rhythm is called bradysystole. A slow pulse, depending on the fact that not all pulse waves reach the radial artery, is called bradyrhythmia (see). Bradycardia occurs in: 1) irritation of the vagus center (for example, as a result of increased intracranial pressure in hydrocephalus, brain tumors, meningitis). 2) With irritation of the vagus trunk by growing malignant tumors, enlarged glands, aneurysms of vessels, and other pathological processes near the vagus nerve. Usually this slowing after some time is replaced by acceleration of P. 3) Constant bradycardias in completely healthy people at 40-50 beats per 1' depend either on a high tone of the same vagus nerve or on the decreased ability of the Keith-Flack node to generate impulses. In experiments on animals, cooling of the Keith-Flack node causes slowing of P. Changes in the area of the Keith-Flack node can sometimes explain the slow pulse in changes in the heart muscle due to sclerosis of the coronary arteries (as well as bradycardias observed in convalescents after infectious diseases, particularly after diphtheria and typhoid fever). 4) Persistent slowing of P. to 30 beats per 1' most often depends on difficulty or disruption of transmission of excitation from the Keith-Flack node to the atria or more often from the atria to the ventricles. According to Lewis, P. below 36 per 1' almost certainly indicates heart block. 5) In acute jaundices, P. often slows down to 45-55 per 1'. This slowing probably depends on irritation of the vagus center by bile acids. 6) Bradycardia is also observed with an increase in blood pressure, especially a rapidly developing one, as for example in lead colic, acute nephritis, and strangulation. 7) In aortic stenosis, even decompensated. 8) In acute inflammatory processes in the abdominal cavity with signs of peritoneal irritation (as a result of reflex irritation of the vagus nerve). 9) In chronic malnutrition and starvation (P. can decrease to 40 per 1'). Rhythm. In a normal person, P. has a completely regular rhythm, with beats following each other at equal intervals. However, there is no complete mathematical accuracy in the rhythm. In normal conditions, the length of individual intervals can fluctuate by up to 20% of the average length, and in children even more. Until very recently, the classification of arrhythmias was based on a purely external sign-P. Meanwhile, the rhythm of P. is determined by the activity of the heart itself. The phenomena of arrhythmia are reflected in P. as such insofar as the sequence of heart contractions changes the magnitude and shape of the pulse wave. To this day, the following designations for the character of P. have been preserved: arhythmicus, alternans, aequalis, bigeminus, bigeminus alternans, trigeminus, quadrigeminus, deficiens, differens, dicrotus, intermittens, inaequalis, irregularis, irregularis perpetuus, paradoxus. After the introduction into clinical practice of studies of venous P. and especially the electrocardiograph, order emerged from this chaos, and at present the doctrine of arrhythmias constitutes a large and relatively well-developed chapter of cardiology. Based on the latest research, each of the above-mentioned names of P. has the following meaning: P. arhythmicus, arrhythmic P., a general term including all types of P. with an irregular rhythm.-P. alternans-P., in which strong and weak beats alternate (fig. 2) (see Heart arrhythmias).-P. aequalis-P. with waves of equal strength and equal intervals, as in normal conditions.-P. bigeminus-P. with alternating pairs of waves of different strength (see Bigeminia, Heart arrhythmias). Closely spaced pairs of waves are separated by long pauses. The first wave after the pause is always higher (fig. 3). At Fig. 2. Pulsus alternans. Fig. 3.
Pulsus bigeminus. The cause of bigeminal pulse is usually various types of extrasystoles, more often ventricular with compensatory pauses and firm coupling (i.e., with always equal time intervals between the first and second beats), when each normal contraction is followed by an extrasystole. Extrasystoles, which most often cause bigeminy, can also form groups of 3-4 beats with proper alternation, in which case one speaks of p. trigeminus, p. quadrigeminus (fig. 4). Such proper alternation of individual normal waves with abnormal ones or groups of waves is called allorhythmia. Extrasystoles can be of the same type or different. The earlier an extrasystole occurs after a normal contraction, the less the ventricle manages to fill and the weaker the resulting pulse wave. In some cases of ventricular extrasystoles, the pulse wave may not be palpable in the radial artery, then bradysphygmia occurs. In all cases of bigeminy, auscultation of the heart reveals paired systoles, and the first tone of the second systole is usually stronger. The electrocardiogram shows proper alternation of normal and extrasystolic complexes. The phlebogram shows a sharp increase in the stagnant g-wave, due to the premature systole causing blood stasis in the veins due to closure of the tricuspid valve (protosystolic Pfropfung) or an increase in the atrial a-wave if the preceding extrasystole coincided with the nearest atrial systole (mesosystolic Pfropfung).
P. dicrotus, or p. res ilienis, is characterized by the same pairwise alternation of beats of different strength as p. alternans and bigeminus (see above), but the cause of its occurrence is different. The double beat of dicrotic P. corresponds to only one heart contraction. It appears due to a sharp increase in the dicrotic (reflected) wave of the peripheral P. (Causes of occurrence see below). The sphygmogram and electrocardiogram give a normal curve.
P. intermittens (fig. 5) - P. with missing individual waves (syn. p. deficiens). Its cause may be very early extrasystoles of any origin appearing after varying numbers of normal waves with compensatory pauses, partial heart block with periods of Wenckebach. The phlebogram and electrocardiogram give a varied picture, depending on the cause that caused P. intermittens.
P. intercurrens - P. in which a regular series of waves is disrupted by an extra wave - as if inserted into a normal interval. In the same sense, the name pulsus intercidens is also used. Its cause is extrasystoles of any type without compensatory pauses. The earlier an extrasystole appears after a normal contraction, the less the ventricle is filled and the weaker the resulting extrasystolic pulse wave. In p. intercidens, the normal pulse wave following an extrasystole is always somewhat delayed and is above normal. This slight delay of the pulse wave is explained by a functional disturbance of the conduction of excitation from the atria to the ventricles due to the too early preceding systole. The increase of this pulse wave depends on the rapid and large diastolic filling of the ventricles with blood, which was delayed in the atria by the too early extrasystole. In this case, the extrasystolic wave is the smaller, the earlier the extrasystole occurs and the less the ventricle manages to fill.

On the phlebogram, the delay of diastolic outflow of blood is expressed in a narrowing of the diastolic collapse and the appearance of either a C-wave (ventricular extrasystole) or a high a-wave (atrial or nodal extrasystole) in place of the next T-descent. On the electrocardiogram, p. intercidens appears as inserted extrasystolic complexes of various type between normal ones.
P. incidens, or p. inciduus - P. in which the series of pulse waves gradually decreases and then increases both in magnitude and in frequency. At the same time, the decrease in waves is accompanied by an acceleration of the rhythm, and their increase - a slowing of the rhythm (fig. 6). It occurs: 1) In respiratory arrhythmia. Acceleration during inspiration, slowing during expiration (fig. 7). These changes do not occur immediately after the beginning of one phase or another, but coincide with the highest point of inspiration and expiration. According to Hering's opinion, respiratory arrhythmia is explained by reflex increase and decrease in the tone of the vagus nerve through the sensory nerves of the lung. On the phlebogram during expiration, the stagnant g-wave sharply increases, which is associated with an increase in intrathoracic pressure and stasis of blood in the veins due to difficult inflow to the heart. On the electrocardiogram, in addition to changes in rhythm, insignificant fluctuations in the magnitude of the P-wave are obtained due to small displacements of the heart axis due to the movements of the diaphragm during inspiration and expiration.
2) In Cheyne-Stokes breathing. A series of pulse waves accelerates during slowing and cessation of breathing and slows down during intensified breathing. The fluctuations in the volume of pulse waves are insignificant in this case. 3) In the Valsalva experiment: after a deep inspiration followed by an expiratory movement with the glottis closed, the pulse quickens, the volume of pulse waves gradually decreases. The acceleration of the rhythm is explained by the reflex from the pulmonary nerves, the decrease in the volume of pulse waves - by the decrease in filling of the heart and lungs with blood due to an increase in intrathoracic pressure. 4) In partial heart block with co-
...
short (3-6 wave) periods of Wenckebach. At the same time, due to gradual slowing of conduction, diastole lengthens, ventricular filling increases, as does the volume of systole and the wave of peripheral pulse. Pulse paradoxus - paradoxical pulse, when with a correct rhythm the volume of pulse waves sharply decreases during inspiration and returns to normal during expiration (see Heart arrhythmias) (fig. 8). Pulse irregularis perpetuus - constantly irregular pulse (fig. 9) (see Arrhythmias, heart-arhythmia perpetua). Methods of research of arterial pulse. External examination. In most people, upon external examination in various parts of the body, one can notice more or less pronounced pulsation of superficially located arteries: usually on the temples, on the neck, at the wrist joint and elbow bend, especially with any strengthening of pulse waves as a result of physiological or pathological processes. In thin people with poorly developed muscles, the pulsatory movements of arterial walls are more strongly expressed; in full young subjects, the arterial pulse is often completely invisible to the eye. Visible pulsatory movements are related less to an increase in the diameter of arteries during the passage of the pulse wave than to the lengthening of the arterial tube caused by this wave and the displacement of the arterial walls, especially at their turns and bends. Palpation of the arterial pulse is the simplest and oldest method of research. It is most convenient to palpate the pulse of the radial artery, although the pulse of any more or less superficial artery (aa. maxillaris ext., dorsalis pedis, temporalis, auricularis, femdralis, tibialis postica) is generally accessible to palpation. With some skill, simply placing the fingers allows one to judge the nature of the pulse wave and other qualities of the pulse. It is most correct to perform palpation with the tips of the II and III fingers, placed along the a. radialis in the lower quarter of the forearm, where the a. radialis lies superficially, under the skin and fascia, on the radius. During palpation, the patient's hand is placed in a convenient position so that tension of the muscles and tendons does not interfere with palpation. When palpating the pulse, one should strictly distinguish the sensation obtained from tension of the arterial walls from intravascular pressure. For this, the tip of the II finger compresses the artery until the pulse completely ceases in the lower segment, and the empty artery is palpated, rolling it and sliding along it longitudinally with the fingers. This allows one to judge the tension, thickness, and uniformity of the arterial wall. The walls of a normal artery are so soft that the finger barely feels them among the surrounding tissues. In arteriosclerosis, the walls of arteries thicken and harden, either uniformly along their entire length or unevenly, in which case the palpated artery resembles a rosary. Sclerosed arteries, having lost their elasticity, become tortuous. This is especially easily and frequently seen on the temporal arteries. Since sclerotic changes in arteries are distributed very unevenly in the body, one should palpate, in addition to the radial, the other arteries mentioned above. Thickened and uniformly hardened arteries can be observed in young people with chronic nephritis and insufficiency of the aortic valves due to hypertrophy of the muscular wall and thickening of the elastic tissue in it. We judge the intravascular blood pressure by the force with which one must compress the upper segment of the artery to stop the pulse in the lower segment. The higher the blood pressure, the stronger the artery must be compressed. The palpating finger will feel the strongest pulsatory thrusts when the pressure exerted is so great that during diastole the finger will compress the artery completely (turning it into a flat ribbon), and during systole the artery will fully expand. Due to frequent developmental anomalies of the radial artery (e.g., its transition in the lower third of the radius to the dorsal surface of the forearm), palpation should be performed either simultaneously or separately on both hands. Different pulses on symmetrical arteries depend either on local circulatory disorders or on difficulties in circulation at the points of exit and along the path of large arterial trunks (see in detail below p. differens). Graphic methods. Sphygmogram. Recording of the arterial pulse curve with the help of instruments was first performed on exposed vessels of animals. Then instruments were constructed for bloodless recording of the pulse in humans and animals. Of the large number of instruments, the most widespread are: Marey's sphygmograph, Jaquet's sphygmo-cardiograph, and Mackenzie's polygraph. The most perfect instrument is Otto Frank's mirror sphygmograph, in which the writing lever is replaced by a weightless light beam (description see Polygraph). A distinction is made between the sphygmogram of 1) central and 2) peripheral pulse. Central pulse. The prototype of the arterial pulse wave is the curve of pressure changes in the aorta. The pulse of the aorta, subclavian, and carotid arteries is called central. The aortic pulse curve consists of the following waves: 1) Initial oscillation (Anfangsschwingung), which lasts from 0.013 to 0.02 sec. It begins at the moment of opening of the aortic semilunar valves, when blood under high pressure immediately enters the aorta from the ventricles. At the same time, due to the inertia of the set-in-motion mass of blood and the elasticity of the aortic walls, the uniform rise is disrupted, giving way to 2-3 small notches. The faster and higher the blood pressure rises, the steeper and higher the ascending limb of the central pulse curve and the more pronounced these notches are. - Then follows 2) the main systolic part (systolische Hauptteil) of the pulse curve, the shape of which depends on the quantity and speed of blood flowing into the aorta and the arterial pressure. In normal conditions, this part of the curve rises in the form of an upward-convex arc, and upon reaching its maximum, it quickly falls at the end of systole, ending in a deep and sharp, downward-pointing notch, called the 'incision' (incisura) of the central pulse. With great resistance in the aorta, for example with stenosis of its mouth or hypertension, the main systolic part has a more gradual rise throughout systole; with little resistance this part of the curve rises steeply, then forms a plateau and ends with a deep notch-the so-called incision. -3) The incision coincides exactly in time with the end of ventricular systole and arises due to the sudden drop in pressure in the aorta at the moment of closure of the aortic semilunar valves. The pressure drops because the column of blood in the aorta suddenly, at the beginning of ventricular diastole, loses its support from below and rushes back downward in the direction of least resistance. The closing semilunar valve cusps bulge downward, and due to the force of inertia of the blood and the elasticity of the valve cusps and aortic walls, a deep sharp notch with several subsequent 'terminal' small oscillations (Nachschwingungen) appears on the pulse curve. According to Otto Frank, the time separating the beginning of diastole from the moment of closure of the aortic semilunar valves is about 0.003 sec. During this period (the 2nd isometric period), while the aortic valve cusps have not closed, there is as it were a physiological insufficiency of the aortic valve. However, the amount of blood that manages to escape into the ventricles in such a short (0.003 sec.) interval is so small that one cannot speak of true 'physiological insufficiency' of the valve. The 'terminal' oscillations, according to Otto Frank, last 0.08 sec. Their force and duration are proportional to the height of the blood pressure. Then diastole begins, blood goes to the periphery, pressure in the aorta gradually falls, and the curve descends in a gentle line, first faster, then slower. At the end of diastole, two small waves appear, barely disturbing the smooth diastolic fall of the curve. The first of these is the atrial wave. 1st preliminary oscillation (Vorschwingung) coincides exactly in time with the beginning of atrial systole and depends on a slight increase in blood pressure in the aorta due to the light impact of blood ejected by the atria into the ventricles against the aortic valves. The lower the arterial pressure, the more pronounced this wave will be. -2nd preliminary oscillation (Vorschwingung) forms a small sharp notch, the beginning of which coincides exactly in time with the beginning of the 'tension time' of the heart (Anspannungszeit) (1st isometric period), i.e., that period when systole has begun but the pressure in the ventricles has not yet had time to rise enough to open the aortic valves. Due to the rapid increase in pressure in the ventricle, the still-closed aortic valves receive a sharp push from below. The subsequent drop in the curve is an expression of the force of inertia of the set-in-oscillation mass of blood in the aorta. Depending on the length of the 'tension period', the notch of the 'preliminary oscillation' is located closer or farther from the base of the ascending limb of the aortic pulse curve. The higher the pressure in the aorta, the longer the tension period and the farther the beginning of the preliminary oscillation moves from the base of the ascending limb of the initial oscillation of the aorta. However, the tension period is very short: according to Otto Frank it lasts from 0.0166 to 0.03.
Both of these notches, as well as the 'terminal' oscillations after the incisura and the notches after the initial oscillation, are so small that their recording is only possible with particularly sensitive instruments. The same form as the aortic pulse is found in the curves of the subclavian and carotid artery pulses. Peripheral 'damping' and 'reflected waves' have little effect on them. Peripheral pulse. The pressure curve of the peripheral pulse basically retains the form of the central pulse, but differs significantly from it in details. A vast literature exists on the peripheral pulse wave. However, most works have only historical interest, since before the invention by O. Frank of the mirror sphygmograph, the basic form of the central pulse curve was not known, from which, undergoing a series of changes, the peripheral pulse curve is born. These changes occur along the path of propagation of the pulse wave through the arterial system under the influence of: 1) inertia of the mass of blood and vessels, 2) interference of centrifugal and centripetal waves, 3) friction of blood against the vessel walls, and 4) natural oscillations of the elastic system. Thus, the peripheral pulse curve cannot be considered as the central pulse curve displaced to the periphery, since in this case the peripheral pulse wave would be a copy of the central pulse wave, with only the difference that its details would be smoothed out. Sphygmogram of the peripheral pulse. The pressure curve of the peripheral pulse, according to Frank, has the following form: at the moment of cardiac systole, pressure in the radial artery rapidly increases and a steep ascent of the ascending limb occurs, the so-called anacrotic limb. On the peripheral pulse, this ascending limb rises more slowly than in the central pulse. This indicates a more rapid increase in pressure in the central arteries. Having reached its maximum, the 'main ascent' (Hauptschlag), the curve descends, forming the descending, catacrotic limb, on which one more or less clearly expressed wave is visible, called the dicrotic. Tigerstedt and most modern authors support O. Frank's opinion that the dicrotic wave is the result of interference of central and reflected waves from the periphery. The same mechanism is also responsible for other oscillations that disrupt the smooth descent of the catacrotic wave. Sites of reflection of pulse waves are sites where large arterial trunks divide into branches, sharp turns, and narrow bony canals. This is indicated by the precisely determined time of occurrence of the dicrotic wave, the constancy of its form, and the unchanging position with increased rhythm. Before the dicrotic wave there is always a more or less sharply expressed depression of the catacrotic, after which most authors retain the name 'incisura'. However, this depression cannot be explained by a simple displacement to the periphery of the 'incisura' of the central pulse, since the lowest point of it is farther from the base of the ascending limb than the 'incisura' of the central pulse curve from the base of the ascending limb of the aortic pulse. The conditions for the occurrence of the dicrotic wave and the 'incisura' of the peripheral pulse are different from the 'incisura' and other oscillations of the central pulse, but at the same time all oscillations that disrupt the 4S smooth course of the catacrotic represent the result of wave-like propagation through the arterial system of the same impulses and displacements that arise at the mouth of the aorta at the moment of closure of its semilunar valves. Thus arises the varied and inconstant form of the dicrotic wave and 'incisura' on the descending limb of the peripheral pulse curve (see Dicrotia). Speed of propagation of the pulse wave. The closer an artery is to the heart, the sooner the pulse wave appears in it. On the basis of the difference between the moment of appearance of the pulse wave in central and peripheral arteries, the speed of propagation of the pulse wave through the arterial system is determined. On the basis of numerous physical researches and experimental observations on animals and humans, it has been proven that the speed of propagation of the pulse wave is directly proportional to the elasticity of the arterial wall and its thickness and inversely proportional to the diameter of the artery and the specific weight of the liquid. These basic factors determine all other conditions affecting the speed of the pulse wave. Special significance for clinical practice is the elasticity of arterial walls. Moens proposed the following formula for determining the speed of the pulse wave, confirmed by Kries: where K=constant, Vp=speed of pulse wave, g=acceleration of gravity, E=coefficient of elasticity of walls, a=thickness of walls, d=internal diameter, and γ=specific weight of liquid. Thus, with increased systolic blood pressure, the elastic tension of arterial walls increases and the speed of the pulse wave increases. With degenerative changes in arteries that reduce their elasticity, the speed of the pulse wave decreases. With age, the speed of the pulse wave increases more or less. According to Weitz and Hartmann, up to 26 years of age the speed of the pulse wave on average equals 7.5 m per second, and from 45 to 55 years-8.0 m/sec. In hypertensives with maximum blood pressure from 180 to 230 and minimum blood pressure from 108 to 165, the speed of the pulse wave on average equals 12.4 m/sec. The maximum described speed equals 14.5. With insufficiency of the aortic valves, the speed of the pulse wave decreases to 5.5 and even 4.6 m/sec. In these cases, the lower the diastolic blood pressure, the lower the speed of the pulse wave. In these cases, the decrease in speed of the pulse wave probably depends on the decrease in elastic tension of the arterial wall. According to Fridberger, the increase in speed of the pulse wave in chronic kidney disease should be attributed to the combination of degenerative changes in arterial walls and hypertension. Decreased filling of the heart (left ventricle) leads to decreased blood pressure and slows the pulse wave (Valsalva's experiment). Changes in the character, height, and tension of the pulse wave. Changes in the pulse wave occurring under the influence of various causes were known to the most ancient researchers. Different authors of all times have proposed many different names for determining the properties and character of the pulse. On the basis of the latest research, all these qualities of the pulse can be reduced to the following three basic properties:
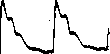
Fig. 10. Pulsus celer.
of the speed, magnitude, and firmness of the pulse wave.-P. celer, quick pulse, a term used to denote the speed of the rise of the ascending and fall of the descending limb of the pulse wave, but not the frequency of the rhythm. The speed with which the pulse wave overcomes the pressure of the examining finger (or peloton) is directly proportional to the rate of increase of blood pressure within the artery. P. celer is most pronounced in aortic valve insufficiency, when during systole the heart immediately ejects a large amount of blood into the relatively poorly filled arterial system. In this defect, blood is ejected especially quickly due to hypertrophy of the left ventricle and low diastolic pressure. The more the aortic valves are damaged and the more elastic the arterial system (in young people), the more pronounced p. celer will be. On the sphygmogram (Fig. 10), a high wave is obtained with an unusually steep, almost vertical ascending limb and a rapidly descending descending limb. One should not confuse the speed of the rise of the pulse wave with its height, as is sometimes done. Indeed, p. celer almost always appears simultaneously with p. altus, but not always p. altus simultaneously with p. celer. In any case, these are two different concepts. P. altus. As the name indicates, the examining finger in p. altus gives the impression of high elevations and deep depressions of the pulse wave. The height of the elevation depends on the magnitude of the systolic filling of the artery and its diameter. The pulse stretching of the arterial tube is small and insignificant. The greatest elevations of the finger (or peloton), i.e., the greatest height of the pulse, occur when the artery is completely compressed by the pressure of the finger (peloton) at the end of diastole, and at the beginning of systole it will expand freely. Then the path of the finger or writing lever will be maximum and equal to the diameter of the artery. Therefore, the wider the arteries, the greater the tension of their walls, and the greater the systolic volume of cardiac contraction, the higher the pulse wave. On the sphygmogram, a high wave of normal shape is obtained. Pulsus altus is encountered with slow rhythm (heart block), physical exertion, strong excitement, etc. In the same sense, the names p. magnus, p. plenus, and p. tardus are used. The concept of slow pulse is used in the sense of slowness of the rise of the ascending and fall of the descending limb of the pulse wave. This depends on the slow and low increase and slow fall of pulse pressure in the arterial system (Fig. 11). It is encountered in aortic stenosis, when the arteries fill relatively slowly through the narrow opening of the aorta. In p. parvus (p. humilis), the sphygmogram gives a low wave of normal shape. It is encountered in spasm of the arterial walls, especially when the volume of cardiac contraction is reduced due to weakness of the heart muscle, or because of imperfect diastolic filling, for example in mitral stenosis g aortic stenosis, after large hemorrhagesg collapse, fainting. P. durus is called the pulse when the examining finger gets the impression of unusual density of the artery, and the effort required for complete compression of the artery by the finger must be great. In such cases, the artery resembles not an elastic tube filled with blood, but a dense wire beating under the finger. The pulse takes on this character with a strong heart, high pressure and Fig. 11. Pulsus tardus. a contraction of the arterial wall musculature. To determine which of the last two factors predominates, one should compress the proximal part of the artery to exclude the internal blood pressure and feel the resistance of the walls of the emptied artery. The usual measurement of blood pressure can accurately determine the magnitude of intra-arterial pressure in mm Hg column. There is no generally accepted accurate method for bloodless determination of the resistance of the arterial wall itself. The sphygmogram gives a steep low rise and oscillations on the catacrotic wave (so-called "elastic oscillations"). P. mollis, soft pulse. In contrast to the hard pulse, it is called soft when the examining finger easily compresses the soft and pliable wall of the artery. In such cases, it is b. or m. difficult to find the radial artery. It is encountered with low blood pressure, a weak heart, pliable and relaxed arterial walls, e.g. in Addison's disease, infectious diseases (typhus, diphtheria, etc.), P. differens-different pulse on symmetrical arteries. In normal conditions, there is no difference between the pulse of the right and left sides of the body. Various pathological processes can deform the arterial tube in the path of propagation of the pulse wave and thereby cause unilateral decreases in filling and pressure of the pulse with or without delay of the pulse wave. The most common cause of p. differens without delay of the pulse wave are unilateral anomalies in the structure or location of vessels in the periphery, compression of arteries by tumors, scars or lymph glands. Among pathological processes within the chest cavity causing p. differens with delay of the pulse wave, first place is taken by aneurysms of the aorta or large branches, sclerotic changes in them, as well as tumors of the mediastinum and retrosternal goiter. Being "absorbers" (Dampfer) of the pulse wave, aneurysms simultaneously slow down the speed of its propagation. If the aneurysm of the aortic arch is located before the place of origin of the innominate artery or after the place of origin of the left subclavian artery, it does not cause a difference in the pulse of the radial arteries. An aneurysm located on the aortic arch between the innominate artery and the left subclavian causes delay and decrease of the pulse wave of the left radial artery. Venous pulse. Since the working heart by thrusts ejects blood into the arterial system and the arterial walls are relatively little stretchable, the pulse movements arising in the arteries represent mainly fluctuations of blood pressure with small fluctuations of the volume of the arteries. In the veins, on the contrary, any pressure waves due to the pliability of the walls will give small fluctuations of pressure, while fluctuations of volume can be great. In normal conditions, the veins accessible to inspection do not pulsate, with the exception of bulbus venae jugularis (and the mouth of v. jugularis extern.). Bulbus v. jugul., being connected with the superior vena cava and the right atrium, passes into itself all the pulsations arising in the right atrium and ventricle during the work of the heart even with the tricuspid valve closed. For accurate assessment of the origin of each wave of the venous pulse, it is necessary to simultaneously record a curve reflecting the activity of the ventricles of the heart; this is best achieved by recording the curve of the pulse of the carotid artery. The fact is that the carotid artery is directly adjacent to the bulb of the jugular vein, as a result of which waves from the pulse oscillations of the carotid artery appear on the curve of the venous pulse. By comparing the simultaneously recorded on the same tape curves of the venous pulse and the pulse of a. carotis, one can with accuracy say to which phase of cardiac activity each tooth of the venous pulse belongs. Sphygmogram of the venous pulse (phlebogram). For recording the venous pulse, a glass funnel 2 to 4 cm in diameter is used, which is applied to the neck above the right clavicle, between the sterno-cleidomastoid muscle, at the place of greatest pulsation of the jugular veins. The funnel is connected to the receiver of the recording apparatus by a dense rubber tube. Om (Ohm) instead of a funnel uses a curved at a right angle light lever; one end of the lever is glued to the skin, and to the other is attached a small mirror reflecting the light beam. The curve of the venous pulse consists of 3 main waves: a, C, and V. The a-wave (from atrium-atrium) is the most pronounced and important wave of the venous pulse, because it depends on the contraction of the atria; it is especially important for the analysis of arrhythmias. The a-wave precedes the appearance of the C-wave caused by the pulse of a. carotis by 0.1-0.2 sec. Consequently, the a-wave arises at the end of diastole, when the ventricles are relaxed and there are no other movements in the heart except the contraction of the atria. Therefore, all researchers agree that the a-wave is the expression of atrial systole. However, the mechanism of the origin of the a-wave to this
Due to the contraction of the circular muscle fibers contained in them; then the wave a is the result of the stagnation of blood flowing toward the heart. Others believe that with each systole, the atrium throws blood not only into the ventricle but also into the mouths of the vena cava. In such a case, the wave a is the consequence of the reverse flow of blood from the atrium into the jugular bulb. According to the first view, any increase in the a-wave indicates an increase in blood flow toward the heart. Under the second assumption, one must think of strengthened contractions of the atrium. Analysis of curves with simultaneous contraction of the atria and ventricles (in nodal extrasystoles, in heart block, in "atrial obstruction" in tachycardia) indicates that there is a reverse wave of blood from the atria into the vena cava, and any reverse flow of blood is equivalent to stagnation. Consequently, the wave a is both a stagnation wave and a wave associated with reverse flow (fig. 12). The C-wave (from carotis) is the transmitted pulse of the a. carotis. This is easily proven, since the beginning of the ascending limb of the C-wave exactly coincides with the moment of appearance of the pulse of the carotid artery, and at this moment there are no other movements in the heart that could cause this wave. Between the a and C-waves there is a small VJc tooth. The exact analysis of the VJc-wave is possible only on curves recorded by O. Frank's mirror capsules. Located between the systole of the atrium (a-wave) and the beginning of ejection of blood from the ventricles (O-wave), the VJc-wave coincides with the beginning of the time of tension of the heart and depends on the change in the shape and position of the heart occurring at the moment of the beginning of systole, as well as due to the bulging of the tricuspid valves toward the atria with increasing intraventricular pressure. These causes cause short-term changes in volume and pressure in the right atrium, affecting the curve of the venous pulse in the form of a small VJc-tooth. From the apex of the C-wave, the curve of the venous pulse descends, forming the y-descent. Since the O-wave is the transmitted pulsation of the a. carotis and is not the true wave of the venous pulse, the beginning of the y-descent refers not to the apex of the O, but to the apex of the a-wave. The waves C and VJc only disrupt the smooth diastolic fall in pressure in the jugular veins, when, following contraction, the atria expand and blood rushes into them. In curves of patients with complete heart block, when the work of the atria is not connected with the work of the ventricles, it is easy to notice that where the atrium contracted independently of the ventricle, after the a-wave there is a small elevation, while where after the systole of the atrium follows the contraction of the ventricles after a normal interval, we see a deep descent of the curve. Therefore, the y-descent can be divided into two parts, of which the first from a to VJc is the consequence of the diastole of the atria, and the second from VJc to the end is caused by the systolic downward traction of the atrio-ventricular boundary and the fall of intrathoracic pressure due to the expulsion of blood by the heart. The point of greatest descent of the curve coincides with the end of systole. By the end of systole, the influence of the above-mentioned causes causing the descent of the curve disappears. From the periphery, new masses of blood approach the jugular vein, and the curve again rises upward. This rise is called the F-wave, which is thus an expression of the stagnation of blood in the atria. In the middle of the ascending limb of the F-wave there is a small tooth c (from Carotisincisur), which in time coincides with the incisura (closing of the semilunar valves) of the pulse of the a. carotis and therefore is the result of oscillations conducted from the adjacent carotid artery. The saddle-shaped splitting of the apex of the F-wave is also caused by oscillations from the closing of the semilunar valves of the aorta, conducted from the heart along the venous system. The different times of manifestation of oscillations from the closing of the semilunar valves indicate that the waves along the venous system propagate more slowly, lagging behind the arterial system on average by 0.06 seconds. The stronger the stagnation in the veins, the more pronounced the F-wave, however, this symptom has no diagnostic value. At the beginning of diastole, the atrioventricular valves open, blood from the atria rushes into the ventricles, pressure in the jugular vein falls, and the curve of the venous pulse descends again. This second descent is called the y-descent. The lowest point of it corresponds to the middle of diastole. At the end of diastole, the veins fill again, and the curve of the venous pulse rises. This rise is not always expressed. It is called the S-wave (from Stauung - stagnation). The longer the diastole lasts, the more expressed the S-wave. Thus there is a second, or diastolic, stagnation wave. Thus, with the systole of the ventricles coincides the lowest point of the curve. Therefore, the normal venous pulse is called negative. With insufficiency of the tricuspid valve, the heart with each systole throws a large reverse wave of blood into the superior vena cava, and on the curve of the venous pulse at the place of its descent a high wave is formed. Such a positive venous pulse with a high wave at the place of the y-descent can also appear with insufficiency of the mitral valve with a simultaneous defect of the septum between the atria. Therefore, the pathological venous pulse is called positive. With atrial fibrillation, the atrial wave a disappears, and on the curve of the venous pulse only two waves C and V remain. If there are stagnation phenomena, the descent y located between the waves C and V is smoothed out, and the wave V increases. As stagnation increases, the wave V becomes larger and larger and finally merges with the wave C, forming one high wave V at the place of the y-descent, and the venous pulse becomes positive. Atrial extrasystoles are reflected on the curve of the venous pulse in the form of extra a-waves, which are especially large if the systole of the atrium occurs simultaneously with the systole of the ventricle. Then the atrium, unable to empty its contents into the ventricle, throws a large wave of blood into the superior vena cava, and on the curve of the venous pulse a high wave a appears, the so-called atrial obstruction (Vorhofpfropfung). Ventricular extrasystoles give an extraordinary C-wave. Extraordinary a and C-waves, coinciding with one or another regular wave of the venous pulse, sum up and give unusually large elevations. After the introduction of the electrocardiograph into the clinic, the diagnostic significance of the venous pulse became secondary. The hepatic pulse is called the pulsatile rhythmic increases and decreases in the volume of the liver under the influence of the changing filling of the hepatic veins. The hepatic pulse occurs almost exclusively under the influence of the reverse wave of blood from the right ventricle into the inferior vena cava with insufficiency of the tricuspid valve. One should not confuse with the true hepatic pulse the pulsatile displacements of the liver that occur under the influence of blows from the hypertrophied heart or the abdominal aorta. For a correct evaluation of the phenomenon, the left hand is placed on the liver from behind, and the right hand presses on the right hypochondrium, where the pulsating and always in these cases enlarged liver is located. With the true hepatic pulse, the examiner will feel rhythmic increases and decreases of the organ. Besides insufficiency of the tricuspid valve, the hepatic pulse can also be observed with mitral insufficiency with a defect of the septum between the atria. The hepatic pulse is a valuable diagnostic sign of tricuspid insufficiency.
Related articles
Mentioned in
Cite this page
“Pulse.” Soviet Medical Encyclopedia. English translation of Bolshaya Meditsinskaya Entsiklopediya, 1st ed. (Moscow, 1928–1936), ed. N. A. Semashko. https://sovietmedicalencyclopedia.pages.dev/article/pulse/