Cardiography
Historical document, translated for reference. It reflects medical knowledge of the 1920s–30s and is not medical advice.
Summary
Cardiography is the recording of heart movements without opening the chest cavity. This 1930s article describes the history, methodology, and clinical significance of cardiographic techniques developed by Marey and Frank.
Encyclopedia article (1928–1936)
CARDIOGRAPHY (from the Greek cardia-heart and grapho-I write), the recording of the movements of the human and animal heart without opening the chest cavity; it was first performed in 1863 by the French physiologist Marey (Marey) using an apparatus invented by him. The modern model of this apparatus (Fig. 1) consists of a hollow drum covered with a rubber membrane with a pelot and connected by a rubber tube to a recording device. The recording of the cardiac impulse initially attracted great attention from physiologists and clinicians, as they hoped to have an accurate and simple method for evaluating cardiac activity in the form of a cardiac curve. However, disappointment soon set in, and the cardiac impulse curve lost almost all diagnostic significance. With the invention by Frank (Otto Frank) of the mirror sphygmograph, in which the writing lever was replaced by a light beam, cardiography again attracted attention. The recording of heart movements is divided into cardiogram - the recording of the cardiac impulse, esophagocardiogram - the recording of heart movements through the esophagus, and cardio-pneumogram - the recording of heart movements by means of the observed changes in pressure in the lungs. The cardiogram is a recording of the movements of the chest wall caused by changes in the shape, volume, and position of the working heart. Consequently, each wave of the cardiogram is the result of movements of different orders. The pressure of the heart on the chest cavity causes an elevation of the curve, while the removal of the heart from it causes a fall of the curve. The receiver is placed over the heart so that the pelot of the apparatus is over the apex at the site of greatest pulsation. If the impulse is not expressed or is weakly expressed, it is necessary to make the recording with the patient lying on the left side. According to Frank's nomenclature: V0 - contraction of the atria, Via - beginning of the tension period of the ventricles, Ax - beginning of the period of ejection of blood from the ventricles, Aa - closure of the aortic valves, E - beginning of the filling period. To evaluate the significance of certain waves of the cardiac impulse, it is necessary to have simultaneously recorded the curve of the central pulse (a. carotis or a. subclavia) next to the cardiogram. U0-wave. The cardiogram begins with a small Vv-wave, corresponding to the systole of the atria and coinciding with the atrial o-wave of the venous pulse and the esophagocardiogram. In some cases, this wave may be unexpressed or weakly expressed, and sometimes negative. According to Wenckebach, the negative form of the U0-wave depends on the fact that the ventricles are somewhat pulled upward and backward by the contracting atria. Therefore, in atrial fibrillation, this wave is completely absent or replaced by small oscillations. The same happens in heart block and in atrial flutter. Vb-B o l n a. The beginning of the ascending limb of the Uk-wave coincides exactly in time with the beginning of ventricular systole, i.e., with the beginning of the tension period. This has been proven on the exposed heart of an animal, where the beginning of the movements of the apex exactly coincides with the beginning of the rise in pressure in the ventricles. The tension period (Anspannungszeit) of the heart is the period that passes from the beginning of systole to the moment of opening of the aortic valves. This period is very short, it is equal to about 0.07 sec. In Fig. 2 it can be seen that the segment of the curve corresponding to this period and enclosed between Fk and Alt consists of two waves: positive and negative. The first wave (positive), according to Frank, depends on the change in shape of the contracting ventricles, and the second (negative) - on the bulging of the atrioventricular valve flaps toward the atria, i.e., on the change in volume of the ventricles. The end of the tension time has no characteristic features on the curve, as it coincides with small oscillatory movements. Therefore, it is impossible to measure the length of the tension time directly from the curve. For this, an indirect method is used, which consists in first determining how much the pulse wave of the central artery (carotis or subclavia) lags behind the Uk-wave of the cardiogram. The pulse wave of the central arteries on average lags behind by
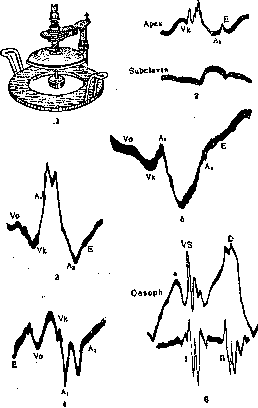
0.01 sec. compared to the opening of the aortic valves. Let us assume that the carotid artery pulse appeared 0.085 sec. later than the Uk-wave; since the blood opens the aortic valves 0.01 sec. earlier, the tension period equals: 0.085 sec.-0.01 sec. = 0.075 seconds. Thus, knowing the length of the tension period and marking the corresponding segment on the curve from the beginning of the ascending limb of the 7k-wave, we will find the point of the beginning of the time of blood ejection from the heart. The tension period is a quantity that changes individually but is extremely constant. To this day, its dependence has not been established either on the magnitude of blood pressure or on any valve defect or on the state of the myocardium. A-l - w a v e begins the period of blood ejection from the ventricles (Austreibungszeit). At the beginning of the Ag-wave, an acute rise (d-tooth) is visible, which quickly transitions into a steep drop (Fig. 2). Two moments participate in the formation of this d-tooth: 1) the recoil of the blood column going into the aorta (similar to the recoil of a rifle when fired), and 2) the rapid longitudinal elongation of the aorta by the blood entering it. The pulse wave of the aorta, in turn, can be broken down into three phases: a-beginning of filling, when the aorta rapidly stretches, b-the stretched aorta remains in this position for some time, and c-the aorta collapses. Each of these moments is sequentially reflected in the shape of the cardiogram. The recoil of the blood during its rapid ejection from the ventricles causes pressure of the apex on the chest wall. The pulsation of the aorta acts in the same way, i.e., the aorta, stretching at the first moment of its filling like any other artery, tends to straighten itself and pushes the heart downward and forward. Thus, an acute tooth is formed. Further, throughout the entire systole, the aorta remains stretched, therefore the heart should constantly be pressed against the chest wall and the curve should be a straight line. However, this does not happen, and the curve quickly drops. This drop depends on the fact that as blood is ejected, the heart decreases in volume and the apex moves away from the chest wall. The time of ejection ends with the 12-wave, which has the form of an acute tooth and coincides exactly in time with the 'notch of the carotid artery pulse curve' (Carotisincisur). Small oscillations follow it. In the interpretation of the A%-wave, all authors come to the same conclusion that it arises due to the reverse thrust of blood against the aortic valves at the moment of their closure. This thrust causes the A^-wave, or the first diastolic wave. The second tone, arising after the closure of the semilunar valves, gives the small teeth that follow the Ag-wave on the curve. After the closure of the semilunar valves of the aorta, the ventricular muscle relaxes, and blood from the atria rushes into the ventricles, forming the E - w a v e, or the second diastolic wave. From the moment of closure of the aortic valves (Ag-wave) to the opening of the atrioventricular valves (E-wave), a certain period of time passes, called the 'period of relaxation' (Entspannungszeit). Like the tension period, it is very short. According to Weitz, it varies from 0.09 to 0.15 sec. With overflow of the atria with blood and with bradycardia, the relaxation period decreases, with tachycardia it increases. After the E-wave follows the already described Yn-wave (caused by the systole of the atria). Cardiogram of a diseased heart. Hypertrophy, expansion, and forward displacement of the heart affect the individual waves of the cardiogram differently, except for the Y0-wave, which always increases. With mitral stenosis, with relatively weak development of the left ventricle, changes in the shape of the working heart are reflected in the curve more strongly than changes in its volume. Therefore, during the ejection period (Fk-At-A2) (Fig. 3), an extraordinarily high and wide tooth is visible, which transitions into a steep drop. With insufficiency of the mitral valve, a picture opposite to stenosis is obtained (Fig. 4). Due to the significant expansion of the cavity of the left ventricle, phenomena of changes in volume predominate on the curve, and the cardiogram shows a sharp drop in the second half of the tension period (Fk-At). During the ejection period, the curve rises somewhat, but its level often lies below the level of the tension and filling periods. Frank calls such curves 'emptying cardiogram' (Entleerungskardiogramm). Due to the large influx of blood from the atria, the diastolic J-wave is sharply expressed. With insufficiency of the aortic valves, the curve during systole has the form of an emptying cardiogram (Fig. 5), but at the end of systole, a rise begins, transitioning into diastole. According to Hess, this rise depends on the approach of the massive apex of the dilated heart to the chest wall. The closure of the affected aortic valves gives a weak A2-wave. The relaxation period (J-wave) is weakly expressed, since the filling of the ventricles begins immediately after the closure of the aortic valves. Thus, the cardiogram makes it possible to measure the length of the tension, ejection, relaxation, and filling periods of the heart. The cardiogram is of great importance in the diagnosis of protodiastolic, mesodiastolic, and presystolic gallop rhythms. In protodiastolic and mesodiastolic gallop rhythms, an additional third tone arises at the beginning or middle of diastole, which is explained by the rapid relaxation of the heart when the ventricles lose their diastolic tone. This rapid diastolic relaxation of the ventricles, coinciding in time with the additional third tone, corresponds on the cardiogram to a high wave appearing after the J-wave. In presystolic gallop rhythm, the additional third tone, appearing before the ventricular systole, coincides with the atrial systole and is explained by the strong muscular contraction of hypertrophied atria. Corresponding to this tone, the cardiogram gives a sharply expressed Y0_v-wave. Since the electrocardiogram does not make it possible to judge either the strength of the heart's muscular contractions or, even more so, the passive diastolic movements of the myocardium, the diagnostic value of the cardiogram in these cases and in measuring the duration of individual periods of ventricular work is exceptional. E s o p h a g o c a r d i o g r a m - recording of the movements of the heart of animals and humans through the esophagus - was first applied by the Belgian physiologist Fredericq at the end of the 19th century. It acquired diagnostic significance in 1907, after the appearance of the works of Minkowski and Rautenberg. To record an esophagocardiogram, a thin probe made of dense rubber with a small balloon at the end is inserted into the esophagus. Lowering the balloon to the level of the heart (about 38-39 cm from the front teeth), the probe is connected to a recording device. The normal curve recorded by the Frank device (Fig. 6) consists of three waves: the a-wave, arising from the pressure of the contracting left atrium on the esophageal balloon; VS, which is a result of the ventricular systole and consists of several large teeth - the result of the combined action of changes in the shape and volume of the contracting ventricles; Xs-stagnation wave, similar to the F-wave of the venous pulse, arising from the gradual increase in pressure and filling of the left atrium from the influx of blood during ventricular systole. The saddle-shaped splitting of the apex of the D-wave depends on the simultaneous closure of the aortic and pulmonary valves. The drop of the D-wave coincides with the opening of the valve flaps and is explained by the rapid emptying of the atria when blood passes into the ventricles. The technique of recording an esophagocardiogram is complex. Meanwhile, the esophagocardiogram has advantages over other methods of recording heart movements. The balloon of the esophageal probe directly adjoins the left atrium and left ventricle, separated from them only by the thin wall of the esophagus, while the pelotte of the cardiograph is separated from the heart by the thick wall of the chest with a solid rib cage. Cardiopneumogram - recording of the movements of air located in the respiratory tract and oscillating under the influence of the impulses of the working heart. For the first time in an animal, it was produced by the German physiologist Landois. The cardiopneumogram consists of two gentle waves: the first, negative, begins simultaneously with the beginning of the heart's systole. It is associated with a drop in pressure in the chest cavity during the ejection of blood from the heart and aorta. The second, positive, coincides with the closure of the aortic valves. Arises due to an increase in intrathoracic pressure during the diastolic influx of blood to the heart. It has no diagnostic value.
Related articles
Mentioned in
Cite this page
“Cardiography.” Soviet Medical Encyclopedia. English translation of Bolshaya Meditsinskaya Entsiklopediya, 1st ed. (Moscow, 1928–1936), ed. N. A. Semashko. https://sovietmedicalencyclopedia.pages.dev/article/cardiography/