Growth
Historical document, translated for reference. It reflects medical knowledge of the 1920s–30s and is not medical advice.
Summary
This article examines the biological process of growth in organisms, distinguishing it from mere mass increase, and analyzes mathematical models and curves that describe growth patterns across different species and developmental stages.
Encyclopedia article (1928–1936)
GROWTH means an increase in the size of a developing organism. In typical cases, G. is associated with an increase in mass, however not every increase in the mass of an organism we designate as G. (e.g., deposition of fat, accumulation of sexual products in some animals, pregnancy may be associated with a significant increase in volume). During G., there occurs primarily an increase in the mass of the active parts of the organism (living 'substance') due to the growth and reproduction of cells and their equivalents. Such G. is characteristic specifically of a developing organism, although it far from always ceases with the achievement of maturity. However, since the growth of a mature organism is never proportional, it is here also associated with changes in form, i.e., with developmental processes. Since poorly differentiated cellular elements of a growing organism, when doubling their volume, divide, and as a result of this division the important metabolic original ratios of surface to volume are restored, this creates the possibility for their unlimited G. and reproduction, provided of course optimal environmental conditions, associated with an unlimited influx of necessary nutrients, salts, water and oxygen. The reproduction of bacteria and other lower organisms in a suitable environment occurs at a constant speed indefinitely long. The same applies to the growth of tissues of higher animals outside the organism (in tissue cultures). Consequently, the growth of active parts of the organism per se could proceed indefinitely long under constant conditions at a constant speed. The result of such growth at a constant speed would be an increase in mass in geometric progression, determined by the mathematical law of organic G. (v=v0ect, where v0-initial growth, t-time, e-base of natural logarithms and c-constant); in reality organisms do not grow this way-their speed of G. continuously decreases, and G. sooner or later reaches a certain limit. The limitation of individual G. of organisms to certain limits is not the result of the exhaustion of any 'growth energy', but the result of complex interactions regulating the formation of form and G. of the organism as a whole. Various attempts have been made to formulate the regularities of G. of organisms. To approach them more closely, one must first give a more precise definition to certain concepts and pay attention to research methodology. To account for the growth of organisms, various kinds of measurements are performed-weight, volume, surface, linear. Since linear G. differs in different directions, more precise data for general accounting could be provided by measurements of surface and especially by measurements of volume, if not for the significant technical difficulties standing in the way of such measurements. Therefore, in practice, the most precise results are given by weight determinations. The source of errors in this case is, besides the consumption and deposition of reserve substances, also the deposition of substances with b. or m. significant specific weight (lime). On the basis of the obtained numerical data, the 'absolute speed' of G. is determined, i.e., the magnitude of the increase of the entire organism (weight, length, etc.) per unit time and the 'relative' or 'specific' speed of G., i.e., the magnitude of the increase of a weight, linear, etc. unit per unit time. The latter magnitude is usually expressed in percentages. Since the speed of G. is a variable quantity, it is completely impermissible to pass from one unit of time to another by arithmetic enumeration (i.e., on the basis of empirical data obtained, for example, as a result of weekly measurements, to determine by simple division the magnitude of weekly increase by seven, resp. by multiplication by four-daily, resp. monthly increase). Likewise, completely incorrect and incomparable results with each other are also given by the usual arithmetic determination of the magnitude of percentage increase. The specific speed of G. must be calculated on the basis of as systematically as possible, through proper, not too large intervals of time collected numerical material exclusively according to the following formula (determined by the law of organic growth and proposed simultaneously by S. Brody and I. Schmalhausen): C = -(log y2 - log y1)/(0.4343(t2-t1)), where log y is the ordinary decimal logarithm of the magnitude found at time t. With systematically (weekly, annually, etc.) collected material t2-t1 equals unity, and division of the difference of logarithms by the modulus (0.4343) is performed very quickly with the help of a small auxiliary table. The numerical material obtained by measurements can be subjected to mathematical analysis. For preliminary orientation, however, the graphical method is simplest and at the same time most illustrative. Usually, on the basis of empirical data, in a system of rectangular coordinates, first the curve of G. is drawn. On the abscissa, the age of the organism is marked as much as possible from the beginning of embryonic development or from birth, and on the ordinate, the sizes of the organism (weight, length, etc.) are marked with points. In the same way, the curve of increase ('absolute speed' of G.) and the curve of specific speed of G. are also constructed. In many cases, the obtained curves have a characteristic, clearly regular form. The curve of G., initially gentle, then rises more and more steeply to a certain turning point, when it again becomes gentler and at the end of G. lies parallel to the abscissa axis. Thus, the curve of G. usually has a characteristic S-shaped bend. The general similarity of this curve with curves expressing the course of certain chemical reactions (W. Ostwald) led some researchers (T. Robertson, S. Brody) to theoretical concepts that considerably simplify the very complex picture of the growth of an animal organism. T. Robertson, developing the views of J. Loeb, believes that at the basis of G. processes lies some guiding autocatalytic monomolecular reaction. The similarity of the organism growth curve with the 'logistic' curve of population G., constructed by the statistician Verhulst, leads most authors (in recent times especially R. Pearl and his school) to accepting a substantial analogy between the growth of an organism and the growth of a free population. A deeper analysis reveals, however, the superficiality of these analogies and the considerable uniqueness of the process of individual G. of organisms, which moreover cannot be completely reduced to one and the same type. The curve of increase ('absolute speed' of G.) first gradually, then faster rises, reaches a certain maximum and then also regularly declines. This circumstance was paid special attention to by the botanist Sachs (J. Sachs), who characterized in this way the 'great period of growth', which also lies at the basis of the recent constructions of Backman (G. Backman). The curve of specific speed of G. has for the most part the form of a curve that initially falls very steeply and then increasingly gently (resembling an equilateral hyperbola). The continuous decrease in the speed of G. as an expression of age-related changes in the organism is especially regular in vertebrate animals. This regularity served as the starting point for the conclusions of Mehnert (E. Mehnert) and for the known theoretical constructions of Minot (C. Minot), to which in recent times I. Schmalhausen has also joined. The mathematical interpretation of empirical data depends to a large extent on the theoretical views of the author. Any curve of G. can be expressed either by a more or less complex power (exponential) formula or interpreted as a parabola with a larger or smaller number of parameters. If the entire curve does not fit within the framework of a single formula, then it is broken down into separate periods or 'cycles' of growth, which are then given an independent mathematical characterization. There is no doubt that the G. of organisms rests on processes of an exponential nature. This however by no means means that at its basis lies some guiding autocatalytic reaction (T. Robertson). The exponential nature of G. is only an expression of the G. of living organisms with their entire mass, since the magnitude of increase at each given moment is proportional to the mass of growing tissues present at the same time. At the same time, however, with few exceptions (insect larvae), the mass of the organism does not increase in geometric progression. If the magnitude of absolute increase increases up to a certain age, the specific speed of growth continuously decreases. T. Robertson's formula undoubtedly does not capture the regularity of this decrease (especially in the embryonic period). From the theoretical side, the most interesting attempt is that of Janisch to find a quantitative expression for various biological processes, including growth, in chain formulas reflecting the unity and inseparability of opposite processes in the organism. However, here also the complexity and undeveloped nature of these formulas are a substantial obstacle to their practical application. On the other hand, potential formulas of the parabola type have great advantages: y=a+bt+ct2+dt3+...+mtn. On the one hand, with the introduction of a sufficient number of parameters, they allow no less approximation to the empirical curve than exponential formulas, on the other hand, formulas of this type can also receive sufficient theoretical justification.
Practical significance is acquired by the simplified formula v-mtk (where m and k are constants), simultaneously proposed for the characterization of embryonic G. by Murray (H. Murray), MacDowell (E. MacDowell), and I. Schmalhausen. Although this formula assumes unlimited G., the growth is continuously slowing down. In many organisms we do indeed observe, although slowed down, G. to deep old age (animals with constant G.); in those cases where visible G. of the mature organism ceases, as in many highly differentiated animals (especially insects, birds, and mammals), here the sharp intervention of new regulating G. factors is clearly manifested, the action of which cannot be fully included in any mathematical formulas. Although the indicated formula, excellently expressing embryonic G. of higher vertebrates, cannot similarly encompass the entire G. of the organism as a whole, it is hardly possible to do so with any other formula either. The simplified formula of parabolic G. quite satisfactorily expresses the basic regularities of G. within individual natural periods and at the same time provides a means for convenient analysis of the entire process as a whole. The specific rate of G. during the embryonic period, as well as within natural postembryonic periods (lactation, childhood until the beginning of puberty, puberty, maturity) falls inversely proportional to the age counted from the beginning of the growth of the embryonic body's rudiment: C = -% - = y. The constant K characterizes the intensity of G. of a given organism (in a given natural period) regardless of the size and age of the organism, which allows for very broad comparisons. The G. constant K remains constant under constant conditions and thus the determination of this value through certain periods makes it possible to judge changes in external and internal G. factors. The calculation of this value, carried out by the formula K = ^-jT-^iUt > гДe «-organism sizes at age t, counted from the beginning of embryonic growth, can be performed with great accuracy on extensive material and taking into account the average and probable error of its average value for a known period. The possibility of simply and accurately characterizing growth and obtaining comparable results for different organisms determines the practical value of the formula. The formula of parabolic G. may also have theoretical justification. It most vividly expresses the age-related character of changes in the rate of G. of the organism. Assuming together with Minot that the decrease in the rate of G. of the organism is determined by the gradual differentiation of its tissues, we can note the regularity of the course of the latter. If only indifferent protoplasm is assimilated, and the products of differentiation are only the result of the transformation of the latter, then parabolic G. is the inevitable result of the exponential increase (with a constant specific rate) of indifferent masses at a constant rate of their hist. differentiation (accompanied by the cessation of independent G.). Thus we naturally pass from the purely exponential process, which, as stated, underlies organic G., to the actually observed, continuously fading G. of higher organisms. A deep connection between the intensity of growth and the degree of differentiation is also revealed in the different rates of growth of various organs. The most differentiated organs (especially the brain) always grow slower than others and this is the reason that in a differentiated organism proportional G. of parts is not observed. The analysis of growth, carried out by the method of determining the parabolic growth constant, reveals in lower vertebrates relatively simple relationships (at least two natural periods: embryonic and postembryonic). In higher vertebrates the entire process is divided into at least 3-4 periods, differing in the value of the constant, which as a rule sharply decreases when passing from one period to the next. The constant of embryonic increase in volume or weight in most birds and mammals is slightly above 3, approaching 4 in large forms. The constant of increase in linear dimensions is approximately 3 times smaller. During the lactation period the value of the constant can still be relatively high. When switching to ordinary food it falls noticeably lower. The beginning of puberty is also usually associated with a decrease in the value of the constant. The final cessation of G., regulated by the internal secretory apparatus, is associated with a sharp drop in the G. constant to zero. In humans the embryonic G. constant is close to 4, but in the last month of intrauterine life and during the first year (lactation) K=1.3, in childhood until 11-12 years K=0.6-0.7, during the puberty period the constant rises again to K=1.4-1.6 (in boys later but higher), then at 18-19 it again falls to 0.6, at which level it remains (with fluctuations) until cessation of G. at 21-23 years. These changes clearly indicate the existence of factors that change in different periods of the organism's life. Birth is associated with a sudden change in all conditions of the organism's existence, but significant changes are also introduced in later periods of life with the transition to other food, with the complication of living conditions and especially with changes in the internal secretory apparatus, which to a large extent plays the role of a G. regulator (especially the pituitary gland). Thus the process of G., and consequently its result—the final*body sizes—is determined by many quantities: the initial mass of the embryonic body rudiment (M), the intensity of embryonic G. (K) and its duration, as well as the intensity of G. and duration of individual periods of postembryonic G. All these quantities are in turn determined by many factors interacting in the developing organism. A picture of very complex relationships emerges and therefore all attempts to mathematically characterize the entire process of G. as a whole are doomed to failure in advance. We must be satisfied with the possibility of accurately identifying only the general regularities of G., which give us the opportunity to analyze this complex process in specific cases, to identify individual dependencies, in order to then, if necessary, be able to exert a certain influence on its course, I. Schmalhausen. Physiology of Growth. The chemical and physicochemical changes of the growing organism have been studied repeatedly. These include the data of Schaefer and Bialasiewicz on the change in osmotic properties of the growing amphibian embryo and the data of Schaefer on water content at different stages of embryo development. Changes in the chemical composition of the growing human organism have been studied by a number of authors; on the basis of their data the accompanying table, borrowed from the summary by G. Aron 'Biochemistry of Growth' (1913) (Table 1 on p. 347), has been compiled. Corresponding data for the growth of rabbits are presented in Table 2 (data of Fehling, Shkarin and Friedenthal). From the data presented it is seen that the percentage content of water progressively decreases during G.: in the embryonic period in humans from 97% to 75%, to one month of age to 70% and in adults reaches 65%. The content of fat, protein and salts, on the contrary, increases. The change in the mineral composition of the growing human organism, starting from the 3-month
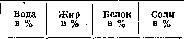
Table 1. Author Age in months Weight in g", "Fehling. . Michel . Fehling. . Michel . Fehling. . Fehling. . Brubacher Fehling . . Brubacher
o dlVa 2i/8 0,975 97,54 17,8 93,82 - 4,25 46,5 91,38 0,51 5,21 87,27 - 8,43 86,47 1,25 7,80 83,20 2,64 10,80 ! 169 80,75 3,95 - 82,90 2,44 10,40 75,28 8,42 - 0,001 0,99 2,-z7 2,37 2,65 P e Фелинг.........Новорожд.З 291 Мишель Камерер и Зельднер Зоммерфельд . . . . Бушар, Бишоф и Фолькман (средняя величина) ...... J3 3H5 2 821 4 340 74,10 69,17 71,10 70,15 9,10 12,30 13,11 11,80 13,63 11,70 14,19 Взросл 64,70 14,83 Новорожденные недоношенные. T a б л. Стадий развития Вода в % I Жир в % Белок (N X 6i/4) в% Соли в Плод от 15 до 30 дней . . От рождения до 1 месяца Взрослые........ . . 91,5-79,4* 77,8-71,2" 2,12-4,90* 7,78 8,5-12,6*) 1,56-2, 18,20 ! 5,84 * Цифры от - до показывают содержание воды и пр. временным точкам изученного периода. относящееся к крайним плода до рождения, прослежено Мишелем, Джа-козой и др. Из их данных составлена табл. 3. Табл. 3. Возраст Минеральные вещества Процентное содержание i От 3 до 1 9 мес < C1........ P2O3....... 2,41- 1,74 5,01-11,73 4,55-12,79 3,28- 2,33 0,12- 0,16 Возрастает содержание фосфора и кальция несомненно за счет P. костного вещества, содержание же остальных элементов минерального состава или слегка убывает (Cl, Na2O) или остается практически неизменным (Fe2G3, SO3, MgO, K2O). Из внешних условий P. необходимо иметь в виду пищу, именно ee количество и качественный состав. Голодание или количественно недостаточное питание ведут к торможению P. Особенно резко сказывается на P. недостаток нек-рых аминокислот, напр. триптофана, тирозина и цистина. B опытах c казеиновой диетой y крыс было показано, что при 18% содержания в пищевом рационе казеина рост идет нормально, тогда как при 9% имеет место его задержка. Вместе c тем, если к 9%-ному содержанию казеина добавить то количество цистина, к-poe содержится в недостающих 9% казеина, скорость P. снова возвращается к норме. B последнее время гл. обр. работами Гам-мета (Hammett) показано очень большое значение для клеточного размножения еульфгидриль-ных соединений, в частности глютатиона. Воз- возможно , что цистин и другие аминокислоты необходимы для роста как-раз как составные части, участвующие в организме в синтезе глютатиона. Повышенное содержание восстановленного глютатиона в тканях, испытывающих интенсивный P. (регенерирующих тканях), показали в последнее время Орехович н Бромлей. Ускорение P. (до 60%) было получено при даче per os и при инъекциях лецитина (Hatai? Kronheim). При изучении P. тканей в культуре in vitro Каррель и Иблинг (Carrel, Ebeling) показали необходимость особых веществ - трефонов, которые появляются при ауто-лизе, при делении клеток. Трефоны содержатся в лейкоцитах, чем видимо объясняются прогрессивные явления в ранах в результате инфильтрирования окружающих тканей элементами белой крови. Помимо трефонов для тканевого P. повиди-мому необходимы открытые Фишером десмоны- i вещества, которые в от-------------------------- личие от трефонов обладают видовой и тканевой специфичностью. Среди элементов пищи особое значение для роста, имеют несомненно витамины. Среди витаминов важнейшее значение для P. имеет витамин A.-Из агентов окружающей среды на P. оказывает влияние t° и свет. Влияние t° подчиняется экспоненциальному закону, т. e. повышение t° до известного предела оказывает стимулирующее влияние, a дальнейшее повышение может привести к торможению P. Видимый свет оказывает по существу тормозящее влияние на P. растений в длину, o чем свидетельствуют непомерно длинные побеги растений, выросших в темноте. Свет тормозит также образование клубней картофеля, y которого можно вызвать образование клубней на надземной части стебля c помощью его затемнения. B особом положении находятся ультрафиолетовые лучи; определенной длины ультрафиолетовые лучи в соответствующей дозе ускоряют P. путем стимуляции клеточного деления, a может быть и обмена веществ растущей ткани (см. Митогенетические лучи). Определенные части организма оказываются регуляторами процессов P. Здесь необходимо отметить нервную систему и железы внутренней секреции. M. Арон в опытах на головастиках показал наличие повидимому двух центров P., расположенных в центральной нервной системе. Опыты перерезания спинного мозга и сращивания частей зародышей делают положение Арона весьма правдоподобным. Опыты денервирования зачатка конечности (Гамбургер) показывают задержку роста в конечности, лишенной нормальной иннервации. По вопро- cy o влиянии на P. желез внутренней секреции имеется очень много данных. Удаление щитовидной железы ведет к заметному торможению P. y овец, коз и свиней, что видно из опытов Эйзельсберга, Винсента и Джолли (Eiselsberg, VIncent, Jolly), a также кроликов (Hofmei-ster). У тиреоидектомированных животных кости остаются короткими, форма их неправильна, окостенение скелета задерживается. Аналогичные явления имеют место y детей при недостаточности щитовидной железы. Дача тиреоидно-го препарата ведет к стимуляции роста таких субъектов.-Еще более отчетливо влияние на P. гипофиза (см.). Менее изучено значение зобной железы (см.). Деятельность щитовидной и половых желез связана c нек-рыми явлениями диференциаль-ного P. Так, половые железы оказывают влияние на развитие признаков пола y позвоночных. Щитовидная железа имеет отношение к метаморфозу амфибий, во время которого часть органов интенсивно растет (ноги, язык, легкие), a часть подвергается обратному развитию (жабры, хвост). Стимулирующее действие гормона щитовидной железы на P. ряда органов во время метаморфоза Шамйи (Champy) объяснял избирательной чувствительностью определенных районов к тиреоидному гормону. Можно однако думать, что гормон щитовидной железы скорее должен стимулировать резорп-ционные процессы. Эти последние в свою очередь могут оказывать стимулирующее влияние на рост других частей организма путем химическим (сульфгидрильные соединения, трефоны, десмоны) и физическим (митогенетические лучи). Аналогичное представление может быть создано для регенерационного и для бластома-тозного роста, так как и в регенерате и в злокачественных опухолях приходится сталкиваться c процессом интенсивно идущего тканевого распада, который может оказывать резкое стимулирующее влияние на P. соседних тканевых участков (регенерационной бластемы, коркового слоя опухоли). Диференциальный P. различных частей организма требует дальнейшего изучения и несомненно в различных случаях получит различное истолкование. У низко организованных живых существ и зародышей дело может итти o различной интенсивности обмена, как это трактует теория физиол. градиента (Child). Своеобразную роль в процессах частичного P. играют организационные центры, изучаемые Шпеманом и его школой (см. Механика развития, Орган, органогенез). Различные авторы по-разному пытались установить причины прекращения роста. Указано много факторов этого процесса: исчерпание клетками недиференцированных элементов плазмы и особенно развитие в них фибрилярного механизма (Майнот, Фриденталь), изменение соотношения ядра и плазмы (Hertwig), ассимилирующей поверхности и массы клетки, накопление продуктов распада ((Muhlmann), сгущение плазмы и обеднение ee водой (Ruzicka), уменьшение поверхностного напряжения, осмоса, дисперсии частиц в связи c изменением ионной концентрации среды (Marinesco), уменьшение ав-токаталитически действующих клеточных энзимов, определяющих ассимиляторную функцию плазмы (Леб, Робертсон), изменение энергетического коефициента, т. e. доли калорий пищи, расходуемой на увеличение массы тела; для удвоения массы человек расходует на 1 кг всегда 28 864 калории, но первое удвоение длится 7 месяцев, второе удвоение-272 года, третье удвоение -6 лет и т. д. (Рубнер). Это связано c увеличением расхода энергии при диссимиляции.
L. Blyakher. Growth, in ordinary Russian usage, means the absolute length of the adult body and its variations by sex, profession, nationality, etc. The increase in absolute body length with age. If we take the length of the longitudinal axis of the human embryo in the first days of life as 0.2 mm, in the newborn as 50 cm, and in the adult male as 165 cm, then during the intrauterine period the body length increases 2,500 times, and during the extrauterine period, 3.3 times. The decrease in the energy of growth with age is also observed throughout individual segments of intrauterine and extrauterine development; it is an expression of the general principle of the decline in the energy of growth as structural differentiation increases, but this slowing of growth occurs unevenly. In the period of early childhood, from 0 to 7 years, the relative magnitude of annual increments in body length constitutes a sequentially but unevenly decreasing series. According to data relating to American children from the privileged classes, the absolute magnitudes of annual growth increments during the first 7 years of life can be characterized by the following figures: 21, 11, 8, 7, 6, 5.5, totaling 63 cm (Baldwin). This is a period of gradually decreasing energy of growth, and it is the same for both sexes. During the period of later childhood, from 8 to 14 years, the decrease in the relative magnitudes of annual growth in boys is expressed very weakly, and the figures do not show a clear sequence. The absolute magnitudes of annual growth fluctuate around 4 cm (28 cm in 7 years), somewhat increasing toward the boundaries of the period. The question of whether there is a regular slowing of growth in the middle of the period, at age 9-11 years—a decrease in growth to 3 cm—cannot be considered finally resolved. At the age of puberty (15-17 years), not only does there not occur any further slowing of the growth increment, but, on the contrary, growth proceeds more energetically, averaging 6 cm per year (18 cm in three years). By age 17, the youth's height is about 159 cm, i.e., about 94% of the final body length. Further growth proceeds less intensively, amounting to 1.5-2 cm per year in the first postpubertal period (18-20 years), totaling 5 cm; in the second postpubertal period (21-25 years), 0.5 cm per year, totaling 2.5 cm; in the third postpubertal period (26-307 years), 0.2 cm per year, totaling 1 cm; for a total of 168 cm. By age 30, growth in length can be considered complete. The growth curve of females differs in the shorter duration of later childhood and the earlier onset of pubertal elongation (as a result of which 15-year-old girls are usually taller than boys of the same age), but mainly in the very weak postpubertal growth. The increment corresponding to the first postpubertal period in males is absent in girls. By age 20-22, their growth ends, and the total body length (in Europeans) is 10-11 cm less than in men. The body length at ages 30-45 in men and 25-30 in women can be considered stable. Subsequently, a decrease in body length is observed due to an increase in the curvature of the spine, flattening of the cartilaginous discs, etc. In the seventh decade of life, the decrease in growth reaches 2.5 cm. There are significant group and individual variations both in the magnitude of the decrease in growth and in the timing of its onset. The increase in body mass with age occurs in a pattern that does not coincide with growth in length (see Body Weight). Variations in growth in individual groups are very great. They relate mainly to the age of onset of pubertal acceleration of growth (early, average, late onset) and its duration. For European peoples, it can be taken as a general rule that early onset of puberty is associated with a shorter duration of subsequent growth periods and a smaller final body size (Boas). On the other hand, delayed maturation also somewhat shortens the postpubertal growth periods and leads to a decrease in final body size. These latter depend, in addition to puberty, on the energy of growth during the period of early childhood (Baldwin). The typology of growth as a whole has not yet been established. The relationship between growth, length, and body mass changes during development. Mass increases more slowly than length. Boys reach half of their final body length at age 2-3 years and half of their body mass at 11-12 years. Postpubertal increase in body length amounts to 6%, and of body mass—more than 16%. This circumstance alone makes futile attempts to encompass with one form suitable for all ages the relationship between length and mass. Quetelet's position—that during the growth period the square of weight changes in proportion to the fifth power of body length—has only approximate guiding value. It is more correct to proceed along the line of differentiation of age groups and to find the relationship between mass and body length by means of correlation for each age group separately. Correlation coefficients show a regular change with age; they increase during puberty and noticeably fall toward maturity (Bunak); at the same time, types of proportional-accelerated, average, or retarded growth are distinguished, the type of accelerated growth in length with retarded or average growth in mass, the type of accelerated growth in width with retarded or average growth in length. Each of these types is characterized by peculiarities of vital activity and behavior, the accounting of which is important in pedology and pediatrics. The mechanism of growth, particularly the skeletal basis of the body, is connected with the activity of epiphyseal cartilages, which produce new cells on both boundaries, the epiphyseal and diaphyseal, with their ossification proceeding from opposite ends. As the production of new cells ceases, the epiphyseal cartilages ossify, after which vigorous growth is no longer possible. In humans, this process occurs during the first 18-20 years of life. The dates of ossification of the epiphyses serve as indicators of the energy of growth in general (see Skeleton). In accordance with them, the growth of other tissues is also inevitably located. The latter occurs in two ways: first, by increasing the size of the formed elements of the cell—in highly differentiated (and therefore early differentiating) cells (neurons, some muscle cells, etc.); second, by cell division—in cells without specific differentiation (coverings, etc.). With the cessation of systematic cell divisions and systematic increase in the size of formed cellular elements (proper cytotypic growth), vigorous body growth ceases. In humans, this coincides with the ossification of the last epiphyses of the long bones, i.e., the end of the period of puberty. But even after this point, cells retain the possibility of slight increase, first by the deposition of assimilable substances around the periphery of the formed elements (residual growth), and second by inclusions (glycogen, salts), increased hydrophilicity of cells, etc. These processes of organotypic growth, falling in the postpubertal periods, increase organs to their final sizes: by 6% along the longitudinal axis and by 12-17% in total body mass. Postpubertal growth is not very specific and is closely connected with the general type of metabolism, unlike growth in the early period. In its regulation, the role of the neurovegetative and endocrine systems is especially great. Endogenous factors of variations in growth, as is clear from the foregoing, must play a large role. Closely connected with peculiarities of metabolism, the hereditary determination of which is beyond doubt, growth proceeds differently in different types. According to the usual view, growth types of children are the prototype of constitutional types of adults (Stockard, Brandt), both reduce to the same peculiarities of metabolism and tone. Proof of such a connection is the high correlation of the sizes of the same children at ages 10 and 16: 0.921 for height and 0.817 for weight (Baldwin). A very high correlation of height and weight in identical twins (0.7-0.9). The hereditary nature of variations in adult height was shown by Galton, who established a high correlation between the height of parents and children. Genetic analysis (Boas, Davenport, Fisher) gives grounds to suppose that variations in growth are determined by several genes, with relatively small growth (retarding factors) being dominant over tallness. Exogenous factors of variations in growth are also significant. The most important of these are nutrition (caloric, mineral, vitamin elements), the air environment, radiant energy, especially ultraviolet rays. Numerous experiments have established a strong change in growth under the influence of each of these factors separately. In relation to humans, one must reckon with the action of a complex in which individual elements cannot be isolated and in which the influence of additional factors (social, domestic, work regimen, physical education, etc.) always participates. Practically, nutritional conditions are the most characteristic of the complex. Experimental and statistical material testifies that insufficient nutrition first of all retards growth in width (Aron, Stefko et al.), and with severe starvation, growth in length also stops (Bollinger). The influence of excessive nutrition has been insufficiently studied.
Attempts to establish a dependence of growth type on the action of isolated factors—climatic, environmental, and others1—have proven unsuccessful. There is no special type of growth for children in tropical or mountain climates, but within each climate there are groups showing different types of Growth. Frequent attempts in previous Russian literature to make a fine differentiation of Growth based on small changes in the social environment have been unconvincing; one can only speak of large social categories. The environmental conditions characteristic of them form complexes that can modify growth. According to new data, urban children are taller than rural children (Syrkin), while the difference between children of workers and employees is less definite. In the West, children of bourgeois classes grow faster than proletarian children (Niceforo), which Pfaundler considers a negative deviation from the average type: the former are taller but thinner. However, urban proletarian children not only have less body length but often also smaller transverse dimensions: meager nutrition with surrogate or incomplete foods, lack of fresh air, care, and early use of child labor in the household, and previously in outside work, create conditions for frequent manifestations of rickets, scrofula, anemia, etc. As a result, the percentage of developmentally retarded children, hypoplastics, and dysplastics increases significantly. The worse development of Berlin proletarian children compared to London children noted in the 1900s was attributed to the circumstance that Berlin's poor inhabited the upper floors of high buildings, and their children had little access to fresh air, while English workers lived in small houses (Grothian). Children's development suffers especially severely during periods of capitalist crises: the accompanying hunger and malnutrition not only retard growth but also cause long-lasting disturbances in the formation of the entire organism. A properly functioning network of children's institutions can bring about significant favorable shifts. The prohibition of child factory labor everywhere resulted in a noticeable increase in average height and weight. The body length of an adult individual varies physiologically between 135 and 195 cm, with Growth of 161-170 cm considered average, and Growth less than 160 cm and more than 170 cm—small and large. Each of these categories is in turn divided into three subcategories. Growth values less than 135 cm and more than 195 cm are pathological. Women's height is 8-11 cm* lower among different races. Group values fluctuate within narrower limits, from 150 to 180 cm in men, with values of 164-167 cm belonging to the average group. Other systems for classifying height values also exist. An exception is made for 3-4 ethnic groups considered as remnants of the most ancient disappearing races, so-called dwarf tribes in Central Africa (Mambwe-141 cm), in South Africa (Bushmen-144 cm), and the Negritos of the Philippine, Andaman, and Melanesian islands (144-146 cm). No definite dependence of height size on climatic and environmental factors is observed: within the same landscape, tribes of very different heights live: on the border of the South African desert—Bushmen and Kaffirs, in Oceania—Polynesians (tall) and Melanesians (short), etc. Similar data are obtained when comparing close types through a detailed analysis of height variation in the mass population of European countries. In France, Italy, and Germany, several zones differing in height have been established, which do not coincide with the physical-geographical conditions of the country but show a clear connection with the ethnic past of the population, or in other words, its racial composition. Therefore, height is considered in anthropology as a hereditarily fixed racial trait, which does not exclude its variability under the influence of exogenous conditions. Professional differences are less definite, connected partly with professional selection (Meuchelsen). These normal variations in body length, caused by the internal and external factors noted above, cannot in themselves be evaluated from a qualitative standpoint, as they represent different but in their own way equivalent categories. One can speak of functional inferiority only in the case of general hypoplasia, i.e., underdevelopment of both length and body mass, whereas body length as such is usually regarded as a neutral anthropometric trait. A height map of the modern population of the USSR shows a predominance of relatively tall stature in Ukraine, in the southeast and northwest of the European part. In the East, relatively short groups of Finnish origin stand out. In the Center and North, average height predominates (Bunak).—Height shows noticeable fluctuations through epochs. There are several theories to explain this phenomenon. In the USSR over the last 50 years, height has generally increased by about 1 cm. This value varies greatly by region (Bunak). For abnormalities of height, see Giants, gigantism and Dwarfism.
Related articles
Mentioned in
Cite this page
“Growth.” Soviet Medical Encyclopedia. English translation of Bolshaya Meditsinskaya Entsiklopediya, 1st ed. (Moscow, 1928–1936), ed. N. A. Semashko. https://sovietmedicalencyclopedia.pages.dev/article/growth/