Electrocardiography
Historical document, translated for reference. It reflects medical knowledge of the 1920s–30s and is not medical advice.
Summary
This article from the 1928–1936 Soviet Great Medical Encyclopedia outlines the history and technical development of electrocardiography, from early experiments by Galvani, Kölliker, and Müller to the invention of the string galvanometer by Einthoven. It also describes the operating principles of string, coil, and cathode electrocardiographs used for recording the heart's electrical activity.
Encyclopedia article (1928–1936)
ELECTROCARDIOGRAPHY, the registration of electrical phenomena appearing in the heart during its excitation, which is of great importance in assessing the state of the heart. If the history of electrophysiology begins with the famous experiment of Galvani, who proved in 1786 the existence of electrical phenomena in an animal organism, then the history of electrocardiography begins with the experiment of Kölliker and Müller, who in 1856 were the first to clearly demonstrate the presence of electrical currents during the contraction of the heart muscle. By placing a frog nerve-muscle preparation on the contracting heart, they obtained a double contraction of the muscle during the heart's contraction: one at the beginning of systole, and another (inconstant) at the beginning of diastole. For the further development of electrocardiography, it was necessary to create a measuring instrument that would be able to register the electromotive force of the heart. It was possible to register action currents in a living human for the first time by means of a capillary electrometer constructed in 1875. In 1887, Waller, by leading off the heart's action currents from various parts of the human body, obtained a curve with three spikes, the so-called electrocardiogram (abbreviated as ECG). Waller proved that our body is a conductor surrounding the source of electrical energy, i.e., the heart. Different points on the surface of the human body, depending on the direction of the electrical axis of the heart, have potentials of different magnitudes. A diagram of the distribution of points with the same potential (isopotential lines) was constructed by Waller. The study of the spikes of the electrocardiogram obtained
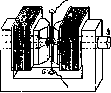
Figure 1. String galvanometer: 1-screen; 2-projection microscope; 3-illuminating microscope; 4-collecting lens; 5-light source; 6-filament.
by a capillary electrometer, yielded insignificant results, i.e., such an electrocardiogram did not accurately reproduce the oscillations of action currents, and its analysis was difficult. The electrocardiogram acquired its significance thanks to the invention by Einthoven in 1903 of an extremely sensitive measuring instrument—the string galvanometer. This apparatus was built on the same principle as the apparatus constructed by Ader for receiving transatlantic telegrams. In a strong magnetic field formed by two shifted poles of an electromagnet, a thin and flexible conductor is stretched. An alternating current passing through this conductor causes it to deflect to one side or the other, depending on the direction of the current (according to Ampère's rule). A light source located in front of the conductor makes it possible to observe and register its oscillations. Such is the principle of the Ader apparatus, which Einthoven used as the basis for his string galvanometer (Fig. 1). In addition to apparatuses built on the type of string galvanometers, there are currently two other types of apparatuses: the coil electrocardiograph (Spulen-Elektrokardiograph) and the recently appeared so-called voltage electrocardiograph (Spannungs-Elektrokardiograph). The latter is easiest to call a cathode electrocardiograph. In the coil electrocardiograph (Fig. 2), the main part of the apparatus is a thin coil with a large number of turns and a small mirror glued onto it. This coil is stretched on two filaments and placed in a strong magnetic field. Under the influence of the passing current, rotation (and not deflection) of this coil occurs. In the cathode electrocardiograph, unlike the string and coil electrocardiographs, it is not the currents arising directly as a result of heart activity that are measured, but the electrical voltage under the influence of the electromotive force of the excited muscle fibers. The voltage arising in the human heart has a magnitude on the order of several millivolts. This voltage is applied to the grid of a cathode voltage amplifier, which increases it by 500–1,000 times. The amplified voltage is applied to the grid of the output cathode tube and causes an oscillation of the anode battery current passing through it (between the filament and the anode). Thus, the current being recorded is not from the heart, but from the anode battery. The oscillation of the human heart's voltage only controls the change in the anode current. Thanks to the preliminary amplification of the heart's voltage, the oscillations of this current are so large that a comparatively coarse galvanometer is sufficient for its registration. All amplification processes in cathode tubes occur without inertia, as they are caused by the movements not of heavy masses, but of a beam of electrons.
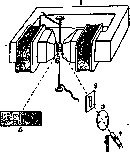
Figure 2. Coil galvanometer: 1-electromagnet; 2-slit; 3-collecting lens; 4-light source; 5-screen; 6-coil.
A measuring instrument possessing the ability to correctly, i.e., without distortion, register oscillations of any character (mechanical, electrical, sound, etc.) must possess certain properties. It is necessary that the instrument, firstly, possess a sufficiently high natural frequency so that its natural period is less than the smallest of the registered oscillations, and, secondly, its damping must be close to critical, i.e., such that the recording instrument becomes aperiodic. Satisfying these requirements is more difficult the higher the frequency and, consequently, the smaller the period of the recorded oscillations. Finally, the instrument must possess sufficient sensitivity, i.e., record the registered curve at a sufficient scale. The instrument that possesses these properties of a good recording instrument (high natural frequency, small natural period, aperiodicity, and sensitivity) to a greater degree can be considered the best. The construction of string galvanometers is basically as follows. On four legs stands a heavy frame forming an almost perfect rectangle. The upper horizontal part of the frame consists of two iron cylinders, between which are located two iron wedges, separated from each other by a few millimeters. The entire upper horizontal part of the frame is drilled in the center for the insertion of illumination and projection microscopes. Both cylinders are wound with thick insulated copper wire. The input and output ends of the coil are located on the lower horizontal part of the frame. If the winding of the cylinders is connected to a corresponding accumulator, the resulting current magnetizes the frame, with one wedge turning into a north pole and the other into a south pole of a very strong electromagnet (on the order of 20,000 gauss, i.e., magnetic units per 1 cm3). Thanks to the wedge-like structure of the poles, the magnetic lines of force are strongly concentrated and have the greatest density in the narrow gap between the wedges. In this gap between the wedges, placed exactly symmetrically to the surfaces of both wedges on a special stand, is the most important part of the instrument—the filament-string. Collecting the rays of an electric arc lamp, the illumination microscope inserted into one of the cylinders casts a bright beam of light onto the middle of the string. By means of the projection microscope located in the other cylinder, the image of the string, highly magnified, is projected onto the light-sensitive paper of the recording apparatus.

The action currents of the heart are conducted into the string. When current passes through the filament, it deflects perpendicular to the lines of force of the magnetic field. The magnitude of the current causing the deflection is directly proportional to the electromotive force causing the deflection and inversely proportional to the resistance (Ohm's law). When current passes through a conductor, the resistance is proportional to the length of the conductor, inversely proportional to the area of its cross-section, and depends on the material from which the conductor is made. All this must be taken into account when choosing the material for the conductor, its length, and thickness. The sensitivity of the filament depends on the length and thickness determined by the material, its flexibility, and the degree of its tension. By increasing the tension of the filament, we make its bending more difficult and lower the sensitivity. To increase the sensitivity and speed of setting, the conductor is manufactured from the thinnest platinum filament, therefore its resistance is quite high. The magnitude of the force that causes the deflection of the filament depends on the voltage of the magnetic field and on the strength of the current passing through the filament. Strengthening the magnetic field is achieved by using powerful electromagnets. In string galvanometers, the strength of the magnetic field is constant. It must be so great that the filament cannot produce its own oscillations due to inertia—it must be aperiodic. The strength of the current depends on the magnitude of the captured electromotive force of the heart, on the resistance of the human body, and on the resistance of the external wires and the galvanometer. The resistance of the human body is not always the same. According to Nicolai, it is equal to 600 ohms; according to Garten, it fluctuates from 1,000 to 2,000 ohms. The resistance of the filament is from 6,000 to 8,000 ohms. The resistance of the filament cannot be reduced, because for this it would be necessary to increase its mass, which would affect the sensitivity of the instrument. With an increase in the tension of the filament, its sensitivity decreases, but on the other hand, due to the increase in natural frequency and consequently the decrease in the natural period of the filament, it can correctly register faster processes, and consequently, the speed of reaction to the passage of current increases. When the filament is loosened, its sensitivity increases, but on the other hand, due to the increase in the natural period, it can correctly register only slow changes in current and becomes, as it were, more inert. Both these circumstances must be taken into account when tensioning the filament.
The most complex part of the string galvanometer is the device that contains the string and regulates its correct position and tension in the apparatus. Strings are delivered from the factory soldered to small copper rods. These copper rods are inserted into the lumen of the hollow cylinder and fastened with a screw. To increase and decrease the tension of the string, there is a special device which is operated by means of a micrometer screw. The length of the string is 8.7 cm. The rods soldered to its ends are fastened with a screw in a metal casing, with the upper rod being electrically insulated from the casing. This makes it possible to measure the resistance of the string while it is inside the casing. The strength of the current passing through the string must not exceed 10-5 amperes. For electrocardiography, silver-plated quartz, aluminum, or platinum strings 2 microns thick are used. The resistance of these strings is 2,000–10,000 ohms. To power the galvanometer electromagnet, large accumulators are used. For each galvanometer, 5–6 cells are taken. A resistance of 20 ohms is introduced into the accumulator circuit so that the current can be introduced gradually. Otherwise, due to the rapid introduction of the field, the string can easily be damaged. To check the degree of charging of the accumulators, a voltmeter is introduced into the circuit, which serves as an indicator of current voltage.
A highly sensitive string galvanometer is under the influence not only of the heart current but also of other factors. Therefore, for its use, a number of additional apparatuses are necessary. The most important is an apparatus for eliminating the influence of constant currents resulting from the vital activity of the organism. With the help of an electrocardiograph, one measures the electrical voltage of the electric current generated in the heart and led off from two places on the body surface. Every functioning organ of our body is a source of electricity. Furthermore, due to polarization between the electrodes with the help of which we lead the heart current from our body and the body surface, a small additional electromotive force arises. All these electromotive forces, originating not from the heart, form constant currents. Upon the action of these currents on the string, the latter would have to deflect strongly and disappear from the field of view. To eliminate their influence, a constant current of constant voltage but opposite direction is introduced into the galvanometer circuit (compensation device). The rapid, rhythmic oscillations of the heart's action currents are not changed by this constant current. Instead of a compensation device, a capacitor is sometimes used to eliminate constant currents. Constant currents cannot pass through a capacitor and are interrupted; alternating currents of high frequency pass without change. In addition, there is a special verification device for checking the sensitivity of the galvanometer. For this, a current of precisely determined strength is passed through the galvanometer. The tension of the string must be such that a specific electrical voltage always corresponds to the specific deflection of the string necessary for the given measurement. To protect the very sensitive string from any sudden oscillations, it is not necessary to pass through the galvanometer at once the entire current that can be led off from the human heart. For this, between the heart and the galvanometer, a compensation device is used.
The connection of the patient to the electrocardiograph is carried out by means of electrodes. The electrodes are metal plates (usually zinc or lead) which are applied to the skin. To improve electrical contact, the skin is moistened with a saline solution or a special paste. The electrodes are attached to the limbs (hand, leg) or to the chest. The standard leads are: I lead—right hand and left hand; II lead—right hand and left leg; III lead—left hand and left leg.
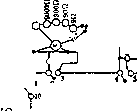
Figure 3. Diagram of current flow in a string galvanometer. An additional resistance is switched in. The diagram (Fig. 3) shows the direction of the current from the person to the galvanometer through all additional devices. The recording part of the apparatus consists of a hermetically sealing box with a narrow slit on the front surface, placed on a special table. In the lower part of the table is a motor. A special rheostat makes it possible to regulate the number of motor revolutions. In the box, on a special axis, a roll of light-sensitive paper is inserted. The motor rotates this roll. Through the slit, the shadow of the string falls onto the paper. On the slit, a scale with 1 cm divisions is placed. Using the scale, before taking the electrocardiogram, one determines the magnitude of the string's deflection under the action of a test voltage of 1 millivolt. In front of the slit, some kind of time marker is also installed (Jacquet chronograph, tuning fork with a certain number of vibrations, etc.), the shadow of which is also reflected on the paper. It is also possible to place additional recording apparatuses in front of the slit, making it possible to obtain simultaneously with the electrocardiogram
Electrocardiography
curves of the apex beat, pulse, etc. By means of a special handle located outside the box, the motor is set in motion, and at the same time, the slit opens. The paper with the recorded curves falls into a special box located below, is cut off, and is developed. For the derivation of action currents, a four-chamber bath can be used. Most often, metal electrodes are used. To obtain an electrocardiogram of special purity, non-polarizable electrodes can be used. As such, Luyas proposes
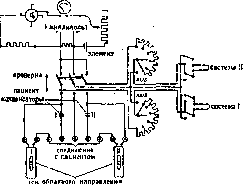
Figure 4. Diagram of current flow in a coil electrocardiograph.
the following device: the limbs from which the current is derived are immersed in a porous vessel containing a warm solution of table salt and absorbent cotton, which gives the solution a mushy consistency. This prevents the formation of wave-like movements in the saline solution, which lead to inconsistency in the magnitude of the moistened body surface and thereby to constant trembling of the string. The vessel with the saline solution is placed in another glass vessel with a concentrated solution of zinc sulfate, into which an amalgamated zinc rod is immersed. A wire runs from the zinc rod to the galvanometer. The disadvantages of this method include the difficulty of applying it to a large number of patients, as it takes a lot of time, and the inconvenience of applying it to bedridden patients. Weber recommends nickel silver electrodes 6 x 25 cm, with which he obtained good curves without additional string oscillations. Straub proposed using steel needles as electrodes, which are inserted intradermally to a depth of 4 mm. Such is, in general terms, the design of the Edelmann string galvanometer. All string electrocardiographs are built according to the above-described model with small changes. The Boulitte string electrocardiograph is quite common in the USSR, distinguished by the fact that it is mounted on a single table. The light source is not an arc lamp, as in the Edelmann apparatus, but an incandescent bulb. There is no capacitor, and the elimination of non-cardiac currents is performed by a compensation device. The time marker is a rotating disk with divisions. The coil galvanometer has a whole series of features compared to the string galvanometer (Figs. 2 and 4). The main part of the galvanometer is a light coil with a small mirror glued to it, hanging on 2 thin stretched wires. The coil winding consists of a large number of turns. At the factory, the tension of the wires between which the coil is placed is set, and the entire measuring system is placed in a hermetically sealed metal case. On the front surface of the case is a small lens, which allows the light beam to hit the coil mirror. Thanks to this installation of the coil, the influence of all kinds of air waves on it is excluded. The measuring system is installed between the poles of an electromagnet. The current for the electromagnet is obtained from special storage batteries. On the path between the battery and the electromagnet, a rheostat is installed, thanks to which one can regulate the current sent to the electromagnet, resp. the strength of the magnetic field. A special ammeter makes it possible to accurately determine the current strength of the electromagnet. A magnetic field of such strength is set so that the system is aperiodic, i.e., would not manifest its own oscillations due to inertia. Under the influence of the currents of the human heart, the coil rotates. Due to the high sensitivity of the system, a rheostat is installed between it and the heart, by which the magnitude of the heart's action currents sent to the system is regulated. In a string galvanometer, both the aperiodicity and sensitivity of the galvanometer are determined by the tension of the string. By increasing the tension of the string, we strengthen the aperiodicity and decrease the sensitivity. By loosening the string, we strengthen the sensitivity but weaken the aperiodicity. With a constant magnetic field of the string galvanometer, one has to select such a string tension that complete aperiodicity and a certain sensitivity are obtained. In a coil galvanometer, sensitivity and aperiodicity are set practically separately. Aperiodicity is achieved by changing the strength of the magnetic field, and the amplitude of the coil oscillations is determined by the magnitude of the heart's action currents sent to the system. A special test device makes it possible to send a voltage of a certain magnitude (1 millivolt) into the system and determine the sensitivity of the system. The light source (Fig. 5) is an incandescent bulb, the light of which, having passed through a collecting lens, hits the mirror of the system. Thanks to a longitudinal slit located in front of the collecting lens, the reflection has the appearance of a strip. Having passed through a cylindrical lens, the light strip turns into a bright point. The oscillations of this point, caused by the heart's action currents, hit a rotating polygonal mirror and are reflected from it onto a special frosted glass. This makes it possible to observe the shape of the electrocardiogram before photographing. When the polygonal mirror is lowered, the light beam hits the light-sensitive paper. But even during photography, not the entire light beam hits the paper. A part of the light beam (about 1/3) hits a special prism located in front of the polygonal mirror and is reflected onto the frosted glass. Thanks to this, we can observe the course of the electrocardiogram even during photography and stop the recording if necessary. The oscillations of the light point are reflected on the light-sensitive paper and are drawn on it in the form of dark lines on a white background. The current for the motor rotating the paper in the cassette is also obtained from storage batteries. The speed of the motor is regulated by a special rheostat and is determined by a tachometer. The elimination of constant body currents in the coil electrocardiograph is achieved by
818 sensitivity. Loosening the string, we strengthen the sensitivity, but weaken the aperiodicity. With a constant magnetic field of the string galvanometer, one has to select such a string tension that complete aperiodicity and a certain sensitivity are obtained. In a coil galvanometer, sensitivity and aperiodicity are set practically separately. Aperiodicity is achieved by changing the strength of the magnetic field, and the amplitude of the coil oscillations is determined by the magnitude of the heart's action currents sent to the system. A special test device makes it possible to send a voltage of a certain magnitude (1 millivolt) into the system and determine the sensitivity of the system. The light source (Fig. 5) is an incandescent bulb, the light of which, having passed through a collecting lens, hits the mirror of the system. Thanks to a longitudinal slit located in front of the collecting lens, the reflection has the appearance of a strip. Having passed through a cylindrical lens, the light strip turns into a bright point. The oscillations of this point, caused by the heart's action currents, hit a rotating polygonal mirror and are reflected from it onto a special frosted glass. This makes it possible to observe the shape of the electrocardiogram before photographing. When the polygonal mirror is lowered, the light beam hits the light-sensitive paper. But even during photography, not the entire light beam hits the paper. A part of the light beam (about 1/3) hits a special prism located in front of the polygonal mirror and is reflected onto the frosted glass. Thanks to this, we can observe the course of the electrocardiogram even during photography and stop the recording if necessary. The oscillations of the light point are reflected on the light-sensitive paper and are drawn on it in the form of dark lines on a white background. The current for the motor rotating the paper in the cassette is also obtained from storage batteries. The speed of the motor is regulated by a special rheostat and is determined by a tachometer. The elimination of constant body currents in the coil electrocardiograph is achieved by
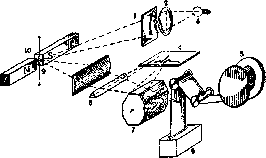
Figure 5. Path of rays in the Siemens-Halske electrocardiograph: 1-slit; 2-collecting lens; 3-incandescent lamp; 4-frosted glass; 5-spare roll of photographic paper; 6-cassette; 7-polygonal mirror; 8-prism; 9-cylindrical lens; 10-measuring system.
with the help of either a capacitor or a compensation device. An electric tuning fork with a small mirror attached to it serves for measuring time; its oscillations are transmitted to light-sensitive paper. The tuning fork is built for 10 oscillations per second. In addition, a Marey capsule with an attached mirror for recording mechanical movements (apex beat, respiration, pulse, etc.) and an Ohm cardiophonograph for registering heart sounds are attached to the electrocardiograph. The coil electrocardiograph has a special device according to Lewis. This device makes it possible to introduce into the coil circuit, when it is connected to the heart, an additional voltage (of 1 millivolt). Quite a few models of cathode electrocardiographs have been proposed. The enormous achievements of technology in the field of construction and improvement of cathode tubes cause the annual appearance of new improved models. When registering the electrical phenomena of the heart with the help of cathode tubes, it is necessary to take into account that Fourier harmonic analysis has shown the low frequency of oscillations of the electrocardiogram obtained in this way. The frequencies of the electrocardiogram fluctuate between 1-50 hertz and are mainly contained between 1 and 20 hertz. To amplify currents of such a low frequency, appropriate cathode tubes must be selected. For amplification and registration, a three-tube amplifier is used at the present time. As anode batteries, 60-volt batteries are used, and as a heating battery, a 4-volt storage battery. The recording apparatus is a small string galvanometer with a permanent magnet. The Siemens cathode electrocardiograph (Fig. 6) consists of a cable with three electrodes for various leads (1); a testing device with a voltage of 1 millivolt (2); a device making it possible to direct either one of the three leads or the test current into the galvanometer (3); a three-tube amplifier (4); an anode battery
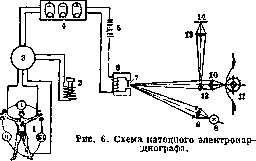
and a heating battery (5); a galvanometer (6) with a mirror (7); an illuminating lamp (8); a lens directing the beam emanating from the lamp onto the mirror and then reflected from the mirror onto the paper (9-10); the paper and the clockwork mechanism moving it (11); and a prism (12) throwing parts of the light beam through a lens (13) onto a frosted glass (14).
Let us now turn to the galvanometers we have described and see to what extent they possess the necessary properties of a good measuring instrument. The sensitivity of a string galvanometer depends on the strength of the magnetic field, on the mass and degree of tension of the string, and on the power of the microscope magnifying the shadow of the string. The strength of the magnetic field in a string electrocardiograph is constant and does not change. The microscope provides a magnification of the shadow of 500-600-1,000 times. The string is made of an unusually thin thread, up to 1 micron in thickness, and by changing its tension with a micrometer screw, one can increase and decrease its sensitivity. In a coil galvanometer, sensitivity also depends on the strength of the magnetic field and on the mass of the coil. In addition, the number of turns of the coil winding plays an important role, as this amplifies the deflecting force of the flowing current. The degree of tension of the threads between which the coil is placed is not so important, because in a coil galvanometer, it is not deflection that occurs, but rotation. The mass of the coil is significantly greater than the mass of the thread, but by increasing the number of turns in the coil, a sensitivity exceeding that of a string galvanometer is achieved. The sensitivity of a coil galvanometer is also increased by the fact that the optics in a coil galvanometer make it possible to increase the deflection up to 4,000 times. The natural frequency in a coil galvanometer, due to the greater mass of the coil, would seem to have to be lower, its natural period longer, and consequently, the speed of setting should be lower, but in a coil galvanometer, it is not deflection that occurs, but rotation, and therefore mass does not play a large role. The natural frequency and natural period in coil and string galvanometers are almost identical. Thus, in terms of sensitivity, natural frequency, and natural period, the coil galvanometer is not inferior to the string one. The aperiodicity of a galvanometer is achieved by the strength of the magnetic field. In a string galvanometer, the strength of the magnetic field is constant. When tensioning the string, two moments must be taken into account: it is necessary to obtain a certain sensitivity of the string, and it is necessary that at this sensitivity there be complete aperiodicity, because with a given magnetic field, aperiodicity is obtained only at a certain string tension. If we, for example, want to obtain greater sensitivity by loosening the string, we must remember that when changing sensitivity for complete aperiodicity, a different magnetic field is necessary, but we cannot change the strength of the magnetic field in a string galvanometer. In a coil galvanometer, we can set the required magnetic field each time. The magnitude of the deflection, respectively sensitivity, is determined by the magnitude of the heart's action currents sent into the coil and is regulated by turning the sensitivity knobs. This independence of the regulation of sensitivity and magnetic field strength is one of the most important advantages of the coil galvanometer. Furthermore, the coil galvanometer is much more convenient to handle, and it is much easier to attach a whole series of additional measuring instruments (for sounds and mechanical curves) to it. Electrocardiograms obtained by a coil galvanometer are more relief-like, because thanks to the optics, they are drawn in black on white, and not the other way around, as in the string one. Thus, for recording an electrocardiogram in a human for clinical diagnostic purposes, the coil electrocardiograph is quite satisfactory and even has some advantages over the string one, but in physiological experiments, where the speed of setting plays an especially large role, the increased weight of the measuring instrument may, however, have an effect, and in these cases, a number of researchers prefer the string electrocardiograph. One of the significant drawbacks of the coil electrocardiograph, hindering its use in electrophysiological experiments, is the imperfection of the Lewis device. The purpose of this device is to make it possible, by including an additional current of precisely measured strength in the circuit, to obtain a standard for measuring the size of the electrocardiogram waves. The device does not perform this task with sufficient accuracy. In a cathode galvanometer, the amplification of the electrical voltage created by the heart occurs without any masses coming into motion. Only the movements of electrons occur. Amplification and transfer of voltage are achieved without having to overcome the force of inertia. The natural frequency in the cathode electrocardiograph itself is thus infinitely large, and the natural period is infinitely small. Polarization phenomena in the electrodes during such a recording of the human heart's voltage do not affect the operation of the device. Thus, cathode electrocardiographs, due to the significant increase in voltage, make it possible to obtain electrocardiograms with large waves. Cathode electrocardiographs appeared quite recently. Their technology is advancing rapidly. The capabilities of these galvanometers are significantly greater than those of the galvanometers (string and coil) registering the heart's action currents. And it must be considered that if at the present time cathode electrocardiographs are still little developed, the future undoubtedly belongs to them. Recording the electrical phenomena of the heart with an apparatus of one design or another gives a characteristic curve—the electrocardiogram.
L. Fogelson. Electrocardiogram. At the moment of activity of living protoplasm, both in an animal and in a plant, a potential difference arises between elements that are excited and those that are at rest; this phenomenon, previously called the negative variation of current, is currently designated as the "action current." The electrophysiology of skeletal muscle and nerve was studied by du Bois-Reymond and Hermann. Waller recorded the heart's action currents, i.e., the electrocardiogram, with the help of a capillary electrometer; due to the imperfection of the recording apparatus, this E. did not reproduce the change in electrical potential oscillations in the contracting heart with sufficient accuracy. Einthoven built (in 1903) a very sensitive string galvanometer (see above), with the help of which the recording of the E. is achieved with greater ease and perfection. Waller established that the surface of the human body (skin) is charged to different potentials in different places and drew a "map" of equipotential lines. The heart's action currents reach the surface of the body, spreading along
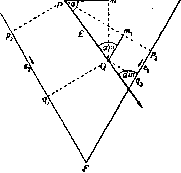
Figure 8. "Diagram of the Einthoven, Fahr, and de Waart triangle."
to the tissues surrounding the heart, as if by conductors. From the Waller-Nicolai scheme (Fig. 7) it is evident that by connecting points with different potentials using a conductor (non-polarizable electrode and wire), one can obtain a current in the external circuit. A galvanometer included in the circuit will show oscillations corresponding to the oscillations of the electrical potentials.
The limbs of the human body are the natural cables through which the current is led to the electrocardiograph (for the recording technique, see below). The scheme shows that with Lead II (right arm-left leg), the electrocardiograph should capture the greatest potential difference; with Lead I (right arm-left arm), the action currents of the base of the heart (resp. right ventricle) are captured primarily, and with Lead III (left arm-left leg)—mainly the action currents of the left ventricle. Currents of different directions interfere both in the heart itself and in the external circuit. Two subjects, by taking each other by the hands (especially if moist), mix the electrical currents of their hearts.
What part of the heart's electrical charge enters the electrocardiograph? This depends on the lead method. The scheme in Fig. 8 shows that depending on the lead method, the waves of the electrocardiogram have different sizes. In this case, the waves of the electrocardiogram taken in Lead II are equal to the sum of the corresponding waves of the electrocardiogram taken in Leads I and III; on the sides of the isosceles triangle (according to Einthoven), composed of the lead points, the projections of the electrical axis of the heart (AB) are depicted: A2B2 = A1B1 + A3B3. Consequently, the electrocardiogram must also change in all leads depending on the displacement (resp. position) of the heart in the chest cavity. Grau and Zelenin proved this experimentally. Thus, the appearance of the electrocardiogram in all leads taken together makes it possible to judge the position of the heart in the chest cavity (normal, horizontal, vertical). This methodology for judging the direction of the heart's axis achieves such precision that is not always available even to fluoroscopy.
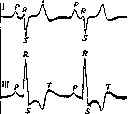
Fig. 9 shows the image of the direction of the electrical axis of the heart and the waves of the electrocardiogram in situs viscerum inversus (dextrocardia); it is evident from it that in Lead I all waves should be directed downward: this is indeed the case with this anomaly. Fig. 10 shows a normal electrocardiogram in 3 leads. Sharp hypertrophy of one or the other ventricle finds its expression in the electrocardiogram partly in connection with the increased formation of action currents by the hypertrophied ventricle, and partly in connection with the change in the configuration of the heart and its rotation around the axis, which changes the arrangement of the ventricle in relation to the chest cavity, i.e., the lead points.

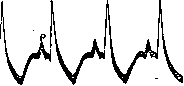
The electrocardiogram in right ventricular hypertrophy (so-called dextrogram) is characterized by a large wave (resp. negative R) in Lead I and a high positive R in Lead II and especially Lead III. A levogram (in pronounced left ventricular hypertrophy) is characterized by a large S (resp. negative R) in Lead II and III and a large positive R in Lead I (Figs. 11 and 12). The cited examples of pathological increase in the mass of one or the other ventricle show, in accordance with what was said earlier, that a positive R wave in Lead III characterizes the predominance of the right ventricle, while a negative R wave (or a very large S) in the same lead indicates the predominance of the left ventricle.
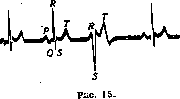
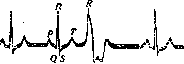
Experimental data and clinical findings have revealed that the appearance of an electrical curve in the form of a levogram or dextrogram can also depend on which ventricle receives excitation first and thus is the leader in the given pathological mechanism of cardiac contraction. Eppinger and Rothberger, upon cutting the right branch of the bundle of His, when the impulse of the atrioventricular node rushed into the left ventricle, bypassing the right, obtained a levogram; upon cutting the left branch—a dextrogram (Figs. 13 and 14). The ventricle to which access of the normal impulse via the corresponding branch is stopped receives excitation by a detour through the remaining branch, consequently later than is the case under physiological conditions. As a result, the ventricular complex of waves takes the form of a levogram or dextrogram, and the time required for the excitation to cover both ventricles (corresponding to the QRS waves) is lengthened (on the curve in Fig. 15, for example, doubled compared to the norm: 0.12 sec. instead of 0.06 sec.). Similar conditions are created during artificial excitation of one or the other ventricle. Kraus and Nicolai, Lewis, L. Hoffman, and others, upon mechanical or electrical irritation of the left ventricle, obtained a levogram in the form of an extrasystole, and upon irritation of the right—a dextrogram (Figs. 15 and 16).
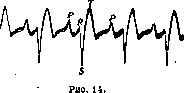
Genesis and significance of individual waves of the electrocardiogram. The P wave is the electrical equivalent of atrial activity. Corresponding to the a wave of the phlebogram, the P wave fully coincided with the contraction of the atria, which were beating in a rhythm independent of the ventricular one. To what extent do the magnitude and configuration of the P wave characterize atrial dynamics? In narrowing of the left atrioventricular orifice ("mitral stenosis"), the P wave is significantly enlarged and often bifurcated (Fig. 17). Thus, an increase in the mass (resp. force of contraction) of the left atrium finds its expression in a large P wave, and the presence of some asynergy in the contraction of the left and right atria is documented by the splitting of the P wave. In atrial paresis, P disappears, and in atrial fibrillation, it is replaced by small wavelets, which are the electrical equivalents of the twitching of individual atrial fibers. A change in the direction of the wave (negative P) indicates that the impulse for contraction is moving not from top to bottom (from the Keith-Flack node to the Aschoff-Tawara node), but in the opposite direction, and that the source of excitation is located somewhere near the atrioventricular boundary. Flattening (or even complete disappearance of P) along with a decrease in all waves (mainly T) is observed in myxedema, which is characterized by extremely sluggish pulsation of the heart (see below).
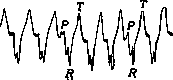
The PQ segment corresponds to the time of passage of excitation from the atria to the ventricles. Practically, the time of passage of the impulse through the conduction system is measured with the inclusion of the P wave and equals, in adults, on average 0.12-0.2 sec. The complex of QRST waves following on the electrocardiogram characterizes the active state of the ventricles. In view of the fact that the Q wave is usually absent, only the remaining 3 waves are subject to analysis. Based on anatomical-physiological data on the functional independence of both ventricles, as well as on the concept of current interference both in the heart itself and in the string of the galvanometer, Zelenin constructed his scheme of current branching (Fig. 18), from which it is evident that despite the homonymous movement of the impulse in both ventricles (from + to -) in the string of the galvanometer the currents from the left and right ventricles move in mutually opposite directions and must undergo negative interference, i.e., subtraction. Experiments by Eppinger and Rothberger with cutting one or the other branch of the bundle of His (Figs. 13, 14), as well as the electrocardiogram of extrasystoles (Figs. 15, 16) originating from the left and right ventricles, and likewise the levogram, resp. dextrogram in ventricular hypertrophy (Figs. 11, 12), gave grounds to assert that the activity of the left ventricle corresponds (in Leads II and III) to a biphasic curve with a first negative phase (S wave) and a second positive one (T), and the activity of the right—to the inverse curve: the first phase positive (R wave) and the second negative (T1). Due to the fact that the R wave prevails in magnitude over S, and T over T1, upon interference of the corresponding phases (algebraic sum of the waves), both waves turn out to be directed positively (i.e., upward). Zelenin's experiments with a dying dog heart confirmed this concept. The hemisystole of the right ventricle, interfering with the hemisystole of the left ventricle, by precise measurement of the corresponding phases, should have yielded the normal (recorded before the experiment) electrocardiogram of the given dog (see Hemisystolia). Wilson and Herrmann, after cutting the right branch, obtained a levogram; then, at the moment of activity of the left ventricle, they irritated the right ventricle and recorded a normal electrocardiogram. Consequently, the normal electrocardiogram of the ventricles is a bicardiogram, i.e., the algebraic sum of the electrical currents originating from both ventricles.
Figure 20. Figure 19. Figure 7. Diagram of the isopotential lines of Waller-Nicolai. Figure 10. Normal electrocardiogram of a dog. Figure 13. Electrocardiogram after cutting the left branch of the His-Tawara bundle. Instead of a normal ventricular electrocardiogram, there is a biphasic curve: the first phase is positive, the second is negative (levogram). The width of these two phases is wider than the normal complex. Figure 14. Electrocardiogram after cutting the right branch of the His-Tawara bundle: the ventricular electrogram has a negative first phase and a positive second phase (levogram). The pathological complex is wider than the normal one (according to Boden). Figure 15. Extrasystole originating from the left ventricle. Figure 16. Electrocardiogram of an extrasystole originating from the right ventricle. Figure 17. Enlarged and bifurcated atrial wave (Hypertrophy of the left atrium and lack of coincidence in the activity of both atria); an enlarged S wave (lead I) indicates the predominance of the right ventricle. Figure 18. Zelenin's diagram: the direction of the electric current in the "ventricles" (in the batteries), the movement of current from the left "ventricle" (LV) to the left arm (LA) and from the right "ventricle" (RV) to the right arm (RA) along conductors to the galvanometer (string G), where the opposite currents meet and subtract. Figure 19. Hoffman-Zelenin diagram. Correlation of curves: electrocardiogram (top), heart sounds (second), apex beat (third), pulse of the carotid artery (bottom). Figure 20. Levogram during digitalis poisoning in a dog.
originating from the right and left ventricles, and these electrograms are discordant, i.e., they have mutually opposite directions of the corresponding phases. It is now clear why there are no such simple relationships between the activity of the ventricles and the complex of waves as there are between the P wave and the activity of the atria, which lack isolated conductors for the impulse and, consequently, anatomical-physiological independence. On the contrary, the theory of the bicardiogram makes it quite clear that by the individual components of the electrocardiogram (R or S) one can judge the predominant role of one or the other ventricle in the mechanism of cardiac contraction (Figs. 11, 12). For a full understanding of the actual relationships, it should be additionally explained why, in the case of left ventricular hypertrophy, there occurs not a simple decrease in the R wave, but an increase in the S wave. This depends on the fact that when the mass of the ventricle increases, it lags behind both in terms of excitation coverage and in terms of the duration of systole. Sometimes it is possible to notice that the R wave corresponds to a negative T wave and the S wave to a positive T wave (see Heart block); this is an expression of longitudinal dissociation (asynergy in the contraction of the ventricles). In other cases, this lack of coincidence in the activity of the right and left ventricles manifests itself in the splitting of the R wave and depends on deep damage to the branches of the conduction system. In this case, a systolic gallop rhythm is heard (Gubergrits).
The question arises: what does the electrocardiogram signify? Are its waves (resp. electrical phenomenon) merely an expression of the excitation coverage of the heart muscle, or do they to one degree or another also characterize the contractile ability of the myocardium? Regarding skeletal muscle, it is known that the contraction phase is preceded by a period of latent excitation. Both phases, physiologically inseparable from one another, can serve as a source of electrical potential difference. Precise measurements have shown that active systole (the ejection period), delimited by the I and II heart sounds, begins at the base of the descending limb of the R wave and ends together with the subsidence of the T wave (Fig. 19). This observation led to the conclusion that the QRS complex of waves relates to the excitation phase, while the T wave characterizes mainly the contractile ability of the myocardium. The T wave, in its configuration and thickness, differs sharply from the high, thin R wave and rather resembles the P wave. Furthermore, deformation of the T wave (lowering, disappearance, or inversion) was frequently observed in myocardial lesions of the cardiosclerosis type.
A. A. Yudin, experimenting on striated (skeletal) muscle, recorded an electrogram with two positive waves: one high and thin, resembling R, and another low, sloping, similar to T. The first wave corresponded to the stage of latent excitation, the second to the moment of muscle contraction. Clinical and experimental facts that have accumulated subsequently likewise indicate that the T wave is an indicator of the anatomical, resp. functional state of the heart muscle. Already in the old works of Müller and Nicolai, there is an indication of the growth of the T wave during physical exertion of moderate intensity and a decrease in the T wave during severe overexertion. Later observations discovered an excessively high T wave in persons engaged in physical labor. The T wave also grows under the influence of hydrotherapeutic procedures that strengthen heart function: cold, resp. carbon dioxide baths (Nicolai), hydroelectric baths (Strubel), and after sports exercises (Strubel). Zelenin, experimenting with preparations of the digitalis group, established a regularity which Straub confirmed: after a significant growth of the T wave (reaching the height of R), the electrocardiogram acquires the character of a levogram, which indicates the predominant role of the left ventricle (Fig. 20). This observation is consistent with the experiments of Shatilov, who established the primary influence of digitalis on the left ventricle. Digitalis bigeminy is also, as a rule, based on extrasystole originating from the overexcited left ventricle. All the listed clinical-experimental data fit perfectly into Zelenin's theory, which attributes the positive T wave to an expression of the activity of the left ventricle.
Einthoven formulates the same thought as follows: "If the right ventricle enters a relaxed state earlier, the T wave goes up; if the left ventricle finishes systole first, the T wave goes down." Zelenin's theory found new confirmation in a comparative analysis of the electrocardiogram and the roentgenokymogram. At the present time, many observations have accumulated indicating that the T wave is subject to toxic influences, the effects of metabolic disorders, the influence of the autonomic nervous system, and the decline of hematopoiesis. Rothberger and Winterberg, upon cutting the vagus nerves, found an increase in P and T and a decrease in R. Cutting the sympathetic nerves produces the opposite picture. Upon irritation of the autonomic cardiac nerves, an antagonistic influence of the sympathetic and vagus nerves on the waves of the electrocardiogram is also revealed. In particular, upon irritation of the left sympathetic nerve, the T wave increases and the R wave decreases (Fogelson), so that the curve acquires a shift toward a levogram. Despite a number of variations in the experiments, it must be recognized that the vagus nerve, by causing a suppression of all heart functions, lowers the T wave.
The influence of thyroid gland dysfunction on the electrocardiogram (mainly the T wave) is very clearly manifested. In myxedema, the T wave is small or completely absent, which fully corresponds to the sluggish contractions of a hypotonic ("vagal") heart. This lowering of the T wave is so characteristic of this disease that the electrocardiogram can be placed alongside the determination of the basal metabolic rate in the symptomatology of myxedema. In thyrotoxicosis and overexcitation of the sympathetic nerve (Basedow's disease), the T wave, on the contrary, is very high (if there are no accompanying myodegenerative changes). The essence of this phenomenon apparently lies in a change in metabolism within the heart muscle itself, which proceeds in parallel with the general metabolism in the body. The parallelism in the growth of the T wave of the electrocardiogram, the increase in basal metabolism, and the change in the configuration of the heart and the frequency and energy of its contractions is very demonstrative. Kabakov (together with Fedorov and Zaydenshnur), during experimental removal of the pancreas, discovered the transformation of the normal pre-experimental T wave into a negative one; after the introduction of insulin, the T wave again became positive. The same phenomena were observed in diabetics: a negative T wave in the stage of acidosis assumed a positive direction under the influence of insulin treatment. These findings confirm Samoilov's view that the T wave characterizes metabolism in the heart muscle. Other forms of toxemia can also change the magnitude and direction of the T wave: nephrotoxicosis, toxin-infectious influences in typhoid and typhus fever, and acute rheumatism; the T wave grows.
Figure 21. ECG during occlusion of coronary artery branches (10 days after occlusion). along with a favorable course of infection. It is not entirely clear whether a rapidly passing acute myodegeneration takes place here, or (which is more likely) whether the metabolism in the heart muscle has been disturbed under the influence of intoxication. Significant disorders of hematopoiesis (Biermer's anemia), by disrupting the nutrition of the heart muscle, can cause a negative T wave, which usually takes on a normal appearance during treatment with liver or gastrocrine. The most convincing evidence in favor of the fact that the T wave is subject to isolated (from other waves) changes during myocardial damage is the observation made by Pardee and repeatedly confirmed by other authors (Ettinger, Damir, Boden, et al.) regarding the characteristic changes of the T wave during occlusion of coronary vessels resulting in myocardial infarction (Fig. 21).
At present, taking an electrocardiogram is considered mandatory during anginal attacks, since electrocardiographic data are often the only objective symptom that decides the issue in favor of myomalacia cordis. In case of occlusion of the left branch of the coronary artery, and consequently damage to the left ventricle, according to the rule discussed above, the coronary wave is revealed mainly in lead III. In case of occlusion of the right branch, a difference in the names of the main waves (R and S) is observed in leads I-III and a positive T in lead III (Boden). We present theories that are not based on the bicardiogram rule and try to find an explanation for the waves of the electrocardiogram in the potential difference of various points of the whole heart. Kraus and Nicolai associate the appearance of the R wave with the contraction of the papillary (or longitudinal) muscles, and the T wave with the region of the "arterial cone" (circular musculature). Gotch considers the QRS complex an expression of excitation running from the apex to the base, and the T wave as the reverse movement of excitation. A number of authors (Bayliss and Starling, de Boer, Hoffmann) speak about the interaction of currents of the apex and the base of the heart. Wedd and Stroud traced the sequence of the onset of excitation at various points of the inner and outer surface of the heart. All these examinations, however, helped very little in understanding the physiology and pathology of the mechanism of cardiac contraction. In general, all these findings boil down to what was established by Lewis's ingenious experiments: excitation (conducted along the branches of the bundle of His) first covers the inner surface of the heart, from there it passes rectilinearly through the thickness of the ventricles to their surface. Further, electric currents spread through the surrounding tissues. The concepts of "onset of excitation" (QRS) and "termination of excitation" (T) clarify little in the phenomenon under study. In the formulation of Einthoven cited above regarding the genesis of the T wave, an indirect recognition of the bicardiogram already shines through. Thus, only the theory of the bicardiogram provides the key to understanding facts valuable for the clinic (right-gram, left-gram, ventricular extrasystole, the influence of cardiac deviations on the methods of leads). The desire, bypassing this rule, to find in the electrocardiogram an expression of changes in the myocardium led to disappointment, as a result of which, after the significant success of Electrocardiography in the analysis of cardiac rhythm disorders, this method began to attract little attention from clinicians. Only after Pardee's description of the coronary wave, which confirmed the opinion of authors who attached special importance to the T wave, did Electrocardiography become an integral part of clinical cardiology.
V. Zelenin. Clinical significance of Electrocardiography. At the suggestion of Einthoven, three methods of leading off heart currents are used: I—lead from both arms, II—lead from the right arm and left leg, III—lead from the left arm and left leg. In this case, the electromotive force of the heart is captured only insofar as it is projected onto the surface of the body. In addition to these standard leads, leads using needles and plates from the region of the heart and back are sometimes used. Wolferth and Wood recommend using the IV lead proposed by them. The patient is placed on the left side. One of the electrodes is placed to the left of the sternum at the level of the IV intercostal space, and the second is placed behind at the same level 180° from the first on the middle of the scapula. Wolferth and Wood believe that sometimes myocardial changes, especially in infarctions, are revealed only in the IV lead. However, further observations on the shape of the electrocardiogram in the IV lead are required both in healthy individuals and in patients. The waves of the human electrocardiogram depend on the lead method. The change in the height of the waves and their relationship depending on the lead method are perfectly illustrated by the equilateral triangle scheme constructed by Einthoven, Fahr, and Waart. The surface of the human body is depicted by them schematically in the form of a plate representing an equilateral triangle (Fig. 8), where the right angle R corresponds to the right arm, the left angle L to the left arm, and the lower angle F to the potential of both legs. Then the lead from R and L will correspond to lead I, from R and F to lead II, and from L and F to lead III. Inside the triangle, the line P-Q is a schematic representation of the potentials developing during the contraction of the heart. P-Q is a characteristic of the electromotive force of the heart E and corresponds to the magnitude of the revealed potential difference of the heart. The arrow shows the direction of the electromotive axis of the heart. The electrical axis of the heart indicates the direction of the electromotive force of the heart. This axis forms an angle α with the line R-L, i.e., the direction of the first lead. The magnitude of this angle determines the direction of the electrical axis of the heart. In Fig. 8 it is seen that with a given direction of the electrical axis of the heart, resp. with a given magnitude of angle α, in the first lead only that part of the electromotive force of the heart (P-Q=E) is captured which is projected onto R-L; in the second—that which is projected onto R-F, and in the third—that which is projected onto L-F. Consequently, the magnitude P1-Q1=e1 is a characteristic of that part of the electromotive force of the heart which is captured in the first lead; P2-Q2=e2—in the second lead, and P3-Q3=e3—in the third lead. When studying this scheme, we can derive the following three equations: 1) e1=E cos α; 2) e2=E cos (α-60°); 3) e3=E cos (120°-α) (the leg is equal to the hypotenuse multiplied by the cosine of the adjacent angle). From this, one can derive the equation e3 = -e1+e2, or e2=e1+e3. Since the expression of the electromotive force of the heart is the magnitude of the waves, it can be concluded that the waves of lead II are equal to the waves of lead I plus the waves of lead III. With a normal heart, this is usually the case. Sometimes, with an unchanged heart, we get figures for the waves that do not fit into the above formulas. This is explained by the fact that the peaks of the waves in different leads do not always coincide. If, for example, the maximum rise of lead II (R2) coincides with such a moment when the R of lead I (R1) has begun to decrease or even reached the zero point, then it is clear that the sum R1+R3 will be less than R2. But for each given moment, which is clearly evident when obtaining all three leads simultaneously, the magnitude of the waves of a normal human heart obeys Einthoven's rule. By the magnitude of the waves of two leads, taken simultaneously with the same resistance and with the same accurately calibrated sensitivity of the string, we can also determine the magnitude of the waves of the third lead. Thus, we see from this scheme that the height of the waves in different leads is determined by the direction of the electrical axis of the heart, resp. by the magnitude of angle α. We can, knowing the magnitude of the waves at a given moment while simultaneously taking an electrocardiogram in two leads, determine angle α. From the previously cited formulas, we can derive the following formulas: tan α = √3(e2+e1)/(e2-e1), tan α = √3(e2+e3)/(e3-e2), tan α = √3(e1+e3)/(e3-e1).
(e4 - e3) Vlf. From this, knowing either eL and ea, or eL and es, or e2 and ea, we can determine the angle α by the formula. Of course, with other leads, corresponding changes in the height of the electrocardiogram waves occur due to the heart's action currents. Usually, in a healthy person with a normal heart position, the waves of lead II are the largest, and those of lead III are the smallest. A simple displacement of the heart to the right or left, depending on mechanical influences (pleural effusions, pneumonia, etc.), is usually reflected relatively little in the electrocardiogram waves. This is explained by the fact that the heart is displaced as a whole, and its electrical axis changes little. In individuals with a high diaphragm position, the angle α, or the direction of the electrical axis, changes. In them, the maximum part of the heart's electromotive force will be captured by lead I, and the minimum by lead II. Therefore, the waves of lead I will be the largest, and those of lead III the smallest. The reverse ratio of the waves will be observed in asthenic body types, when the shape of the heart approaches a hanging one. In this case, the electromotive force, or the waves of lead I, will be the smallest, and those of leads II and III will be almost identical. The most curious are the changes in the electrocardiogram in situs viscerum inversus. The position of the heart in the chest cavity, or the direction of its electrical axis, is in this case a mirror image of the normal. Therefore, the electrocardiogram (Fig. 9) in lead I will be a mirror image of the normal one with the P, R, and T waves directed downwards. Normal breathing is little reflected in the height of the electrocardiogram waves. Only forced inspiration and expiration cause a change in the waves. During inspiration, the diaphragm descends, and the heart assumes a hanging position. It is clear that the waves of lead I will decrease, and those of lead III will increase. During expiration, the diaphragm rises, and the heart assumes a lying position. Consequently, the waves of lead I will increase, and those of lead III will decrease. It is also necessary to take into account the change in the tone of the extracardiac nerves during the act of breathing. Inspiration, by stimulating the sympathetic nerve, and expiration, by stimulating the vagus nerve, cause a corresponding change in the heart rhythm and are reflected in the amplitude of the electrocardiogram. A normal electrocardiogram is obtained as a result of the interference of currents originating from the right and left ventricles (Einthoven, Zelenin) and consists of a levocardiogram (electrocardiogram of the left ventricle) and a dextrocardiogram (electrocardiogram of the right ventricle). With uniform hypertrophy of both ventricles, the electrocardiogram does not change. When, with predominant hypertrophy of one of the ventricles, the ratio of their masses changes, this causes a change in the ventricular complex of the electrocardiogram. With hypertrophy of the left ventricle, a high R in lead I (R1) is observed, and S3 is sharply increased and significantly exceeds R in lead III (R3) (Fig. 11). With hypertrophy of the right ventricle, on the contrary, the magnitude of S1 exceeds R1, and the magnitude of R is maximal in lead III (Fig. 12). At the present time, it has been clarified that the cause of the change in the electrocardiogram is not a change in the ratio of the masses of the ventricles. Experimental data have shown that an electrocardiogram analogous to that obtained with the predominance of one or the other ventricle can be obtained by rotating a normal heart around its axis. When rotating to the right, an electrocardiogram characteristic of the predominance of the right ventricle appears; when rotating to the left, one characteristic of the predominance of the left ventricle appears. Apparently, in the appearance of a characteristic electrocardiogram, it is not the predominance of the mass of individual ventricles that plays a role, but the rotation of the heart around its axis caused by hypertrophy. This rotation causes an increase in the corresponding part of the ventricles adjacent to the frontal surface of the chest wall and the appearance of a typical electrocardiogram. Electrocardiography is of enormous importance in the analysis of various disturbances of the heart rhythm. In sinus bradycardia, the electrocardiogram waves do not change; only the interval between individual contractions lengthens. The electrocardiogram waves also do not change in sinus tachycardia. With a sharp shortening of the diastole, the atrial P wave is superimposed on the T wave of the preceding contraction. In atrioventricular rhythm, the atrial P wave will be directed downwards—negative, because the atria receive excitation retrogradely from the atrioventricular node. Depending on the starting point of excitation in the atrioventricular node, the negative P wave will be located either in front of the R wave, or will be superimposed on the R wave, or will be placed between the R and T waves. The shape of the ventricular complex of the electrocardiogram does not change. In extrasystole, electrocardiography makes it possible to establish the starting point of the premature contraction. In sinus extrasystoles, the shape of all electrocardiogram waves is unchanged. For atrial extrasystoles, the presence of a P wave is characteristic. The shape of the atrial P wave of the electrocardiogram in an atrial extrasystole depends on the site of origin of the excitation in the atria. The P wave of an atrial extrasystole differs from the P wave of a normal contraction. It is increased or decreased, rounded, bifurcated, notched, and can be positive (directed upwards) or negative (directed downwards). The connection of the shape of the P wave with the starting point of the origin of the atrial extrasystole cannot be considered finally clarified. It can only be said that extrasystoles with a positive P wave apparently arise in the right atrium, in parts close to the sinus node, and extrasystoles with a negative P wave—in the left atrium, in an area close to the atrioventricular node. Depending on the point of origin of the extrasystole, its atrioventricular interval (P-Q) can be shortened, lengthened, or remain normal. The ventricular complex in an atrial extrasystole is usually unchanged, because the excitation arises above the division of the bundle branches. In atrioventricular extrasystoles, the P wave is negative. Depending on the starting point of the extrasystole in the atrioventricular node, the P wave is located, as in atrioventricular rhythm, either in front of the R wave, or merges with the R wave, or is located between the R and T waves. Characteristic of the electrocardiographic picture of a ventricular extrasystole is the absence of a P wave and a changed ventricular complex. The initial part of the ventricular complex is widened because the duration of the process of the ventricles being covered by excitation is increased. The increase in the duration of excitation is explained by the fact that the ventricles are not covered by excitation simultaneously. The slowed course of the ventricles being covered by excitation entails a slowed cessation of excitation in them. The period when both ventricles are covered by excitation and the string of the galvanometer does not oscillate (S-T of the electrocardiogram) is small or completely absent. The process of being covered by excitation directly passes into the process of cessation of excitation, and QRS directly passes into T. T is also widened and usually has the opposite direction. The entire electrocardiogram has a biphasic character. The R wave is usually increased, often split or notched. This splitting apparently arises when the process of excitation passes from one ventricle to the other. The question of the topical diagnosis of the starting point of excitation in ventricular extrasystoles has not yet been resolved. To resolve this very important question, Kraus and Nicolai stimulated various points on the surface of the heart and identified three forms of ventricular extrasystoles. The first form—A (Apex)—occurs, in their opinion, upon stimulation of the apex in the region of the left ventricle and is characterized by a downward-directed initial part of the ventricular complex (QRS) and an upward-directed final part of it (T). The second form—B (Basis)—occurs upon stimulation of the base in the region of the right ventricle and is characterized by the opposite direction of the waves. Finally, the third form—C—has an intermediate appearance between A and B and is obtained upon stimulation of the surface between the base and the apex of the ventricles. According to Lewis, who stimulated not only the outer surface of the ventricles in dogs but also the inner one, the difference in the direction of the waves depends not on what is being stimulated, the apex or the base, but on which ventricle is being stimulated—the right or the left. In this case, stimulation of the left ventricle gives the form A described by Kraus and Nicolai, and the right—form B. Form C is obtained upon stimulation of the interventricular septum. The experiments of Rothberger and Winterberg upon stimulation of various points on the surface gave results partially coinciding with the data obtained by Lewis. The difficulties in evaluating all these experimental data and transferring their results for the topical diagnosis of ventricular extrasystoles in humans lie in the following very important circumstances. In a ventricular extrasystole in humans, the direction of the electrocardiogram waves in lead I is opposite to the direction in lead III; lead II in shape usually approaches lead III (discordant).
In dogs, and generally in all mammals except humans and anthropoid apes, the electrocardiogram is of a uniform type (concordant), i.e., the waves are directed in the same direction in different leads. This completely coincides with the experience of cutting the bundle branches (see below). However, the opposite direction of the waves during extrasystole in leads I and III is not always observed in humans, just as, incidentally, uniformity is not always observed in experiments on dogs. This makes the evaluation of experimental data extremely difficult. Furthermore, during experimental stimulation of any point on the surface of the heart, the excitation spreads evenly through the ventricular musculature until the moment it reaches the conduction system, and then it rapidly encompasses both ventricles sequentially. The shape of the extrasystolic complex will be determined by the location of that point in the conduction system to which the irritable impulse arrives first. It is difficult to precisely establish this point when stimulating the surface of the heart. All these difficulties in evaluating experimental data have led to the fact that the question of the topical diagnosis of ventricular extrasystoles remains unresolved to this day. Based on experiments, Lewis for a long time believed that in ventricular extrasystoles originating from the left ventricle, when the excitation encompasses this specific ventricle first, in the presence of all the above-described signs of an extrasystolic complex (absence of P, widened and often notched QRS, and a wide T), the QRS in lead I is directed upward, and T is directed downward. In lead III, the QRS is directed downward, and T is directed upward. And with extrasystoles originating from the right ventricle, the opposite direction of the waves is observed. But in 1930, Barker, McLeod, and Alexander, upon stimulating various points of the exposed human heart, came to opposite conclusions. With extrasystoles originating from the right ventricle, the QRS was directed upward in lead I, and with left ventricular extrasystoles, the QRS in lead I was directed downward. Most American authors currently agree with the opinion of Barker, McLeod, and Alexander. This question cannot yet be considered definitively resolved, especially since the experimental work of Katz and Ackerman showed that the position of the heart is of great importance in the electrocardiographic picture of extrasystole. In an experiment, when the heart was rotated around its axis, extrasystoles having a right ventricular form often took on a left ventricular form and vice versa. Summarizing, it can be considered that the analysis of the electrocardiographic picture of ventricular extrasystoles yields two types: the left ventricular type (by the old classification) with an upward-directed QRS in lead I, and the right ventricular type with a downward-directed QRS in lead I (Figs. 22 and 23). Based on our knowledge of this issue, one cannot speak with certainty about the point of origin of a ventricular extrasystole based on the shape of the electrocardiogram. The resolution of this question requires further experimental and clinical observations. Everything said about the topical diagnosis of extrasystoles also applies to the determination based on the electrocardiogram of the point of origin of the impulse in paroxysmal tachycardia (see Paroxysmal Tachycardia and Extrasystole).
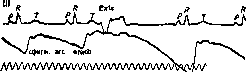
Electrocardiography makes it possible to establish all types of conduction disturbances (see Heart Block). In sino-auricular block, there is a complete dropout of the atrial and ventricular complexes of the electrocardiogram. In intra-atrial block, the atrial P wave is widened, split, and bifurcated. In various types of incomplete atrioventricular block, the electrocardiogram makes it possible to establish the relationship between atrial and ventricular contractions. In complete atrioventricular block, it is clearly visible on the electrocardiogram that there are independent and mutually autonomous contractions of the atria and ventricles. The relationships between atrial and ventricular contractions also appear clearly in another rhythm disturbance, the so-called interference dissociation (see Heart). The diagnosis of bundle of His branch lesions became possible only with the advent of the electrocardiograph. In bundle branch block, the initial part of the ventricular complex (QRS), which characterizes the process of excitation encompassing the ventricles, is significantly widened and notched.
The duration of the QRS, instead of the normal 0.06–0.08 seconds, reached 0.16 seconds. This increase in duration is explained by the non-simultaneous encompassing of both ventricles by excitation, whereby the ventricle with the unaffected branch is excited first, and then the one with the affected branch. The notches on the QRS are explained by the transition of excitation from one ventricle to the other. The amplitude of the R and T waves of the electrocardiogram in block is increased. The T wave is widened and is usually directed in the direction opposite to the direction of the initial part of the ventricular complex, and the entire curve takes on a biphasic character. At the present time, in the literature, as with the similar question about the point of origin of excitation in extrasystole, there is a discussion about which electrocardiographic picture corresponds to a block of the right and left branches of the bundle of His. The electrocardiographic picture in experimental block differs by some characteristic features compared to clinical forms of block. As with experimental extrasystole in dogs, when their bundle branches are cut, the direction of the electrocardiogram waves in all leads is the same. When the left branch is cut, the initial part of the ventricular complex in all leads is directed downward, and the final part is directed upward; when the right branch is cut, the direction of the waves is the opposite. The electrocardiogram is of a uniform type (concordant). In clinical cases of bundle branch block and in experiments on anthropoid apes, the direction of the waves in leads I and III is opposite (discordant). The direction of the waves in lead II usually approaches the shape of lead III. Until now, it was believed that in right bundle branch block, the initial part of the complex (QRS) in lead I is directed upward, and the final part (T) is directed downward; in lead III, the initial part is directed downward, and T is directed upward. In left bundle branch block, the initial part is directed downward in lead I, and T is directed upward, while in lead III, the initial part is directed upward, and T is directed downward. American authors Mann, and Wilson, McLeod, and Barker have recently come to opposite conclusions based on their experimental data. These authors believe that the electrocardiographic picture of left bundle branch block is caused by a block of the right branch, and vice versa. Roberts, Crawford, Abramson, and Gardwell, based on their experiments on cats, believe that the decisive factor in establishing the topical diagnosis of a block is lead I, both in the concordant and discordant direction of the waves. When the initial part of the ventricular complex in the first lead is directed upward, this indicates a block of the left branch; the direction of the initial part in the first lead downward indicates a block of the right branch. Katz and Ackerman...

Figure 22. ECG in left ventricular type of extrasystole.
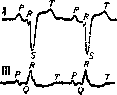
Figure 23. ECG in right ventricular type of extrasystole.
Figure 24. ECG in left ventricular bundle branch block. On the basis of their experiments, they believe that a block of the same branch, just like an extrasystole originating from the same place, can produce a different electrocardiographic picture depending on the position of the heart. Thus, the question of which electrocardiographic picture corresponds to a block of the various branches cannot be considered resolved. The resolution of the question is complicated by the fact that pathohistological studies show that in humans, one branch is very rarely affected; usually, the pathological process involves both branches of the bundle of His. Consequently, in bundle branch block, as in extrasystole, one can speak at the present time of a right ventricular type of bundle branch block with an upward direction of the initial part of the ventricular complex in lead I and a downward direction in lead III, and a left ventricular type of block with the reverse direction of the waves, without definitively prejudging which type of block actually corresponds to the interruption of impulse conduction in the various branches (Figs. 24 and 25). It must be noted that the right ventricular type of bundle branch block is observed significantly more often than the left ventricular type. In a differential diagnostic respect, it is very important to distinguish the electrocardiographic picture of a block of individual branches from the picture, which strongly resembles it, in hypertrophy of individual ventricles. Lewis believed that the main difference between bundle branch block and ventricular hypertrophy is the opposition of the direction of the initial and final parts of the ventricular complex in bundle branch block. However, often even with the predominance of one of the ventricles, especially when it is sharply pronounced, the R and T waves are directed in opposite directions. The main difference is the shape of the QRS. In hypertrophy, excitation covers both ventricles simultaneously. Therefore, there are no conditions for either a sharp widening of the QRS or for the appearance of notches and splitting on it. (Figure 25. ECG in right ventricular bundle branch block). A widened and notched QRS is the main sign distinguishing bundle branch block from hypertrophy of individual ventricles. The electrocardiographic picture in block of the ramifications of the conduction system is characterized by a sharp decrease in all waves of the electrocardiogram, widening of the QRS, and a change in the T wave. In atrial fibrillation (see Atrial fibrillation), the cessation of atrial contractions and the onset of fibrillation are reflected on the electrocardiogram by the disappearance of the P wave. The appearance throughout the electrocardiographic curve of numerous different oscillations is clearly evident during the S-T and T-R intervals, when the string of the electrocardiograph is at rest. The amplitude of these oscillations is different. The ventricular complex usually has a normal shape and follows at unequal intervals. Oscillations caused by atrial fibrillation can slightly distort the shape of the ventricular complex. Sometimes, deformation of the ventricular complex of the electrocardiogram is observed, explained by functional blocking of the ramifications of the conduction system. In flutter, atrial contractions are reflected on the electrocardiogram by F waves following one another, usually without any intervals; these waves usually have a steeply rising ascending limb and a more gentle descending limb. The amplitude of the atrial waves is greatest in leads II and III, and smallest in lead I. Atrial waves are superimposed on the ventricular complex and sharply deform it. The T wave is deformed particularly sharply, and this wave becomes difficult to distinguish. With a large number of ventricular contractions, functional blocking of individual branches and ramifications of the conduction system is sometimes also noted during flutter. In ventricular flutter, there is a large number of chaotic waves of different shape and size on the electrocardiogram instead of ventricular complexes. In pulsus alternans (see Cardiac arrhythmias) in humans, the electrocardiogram remains the same during contractions corresponding to large and small pulse waves. Acute endocarditis, if it is not accompanied by myocarditis, does not cause changes in the waves of the electrocardiogram. In heart defects, hypertrophy and dilation of individual heart chambers are reflected in the shape of the electrocardiogram. In stenosis of the left atrioventricular orifice, hypertrophy and dilation of the right ventricle are manifested by the shape of the electrocardiogram characteristic of right ventricular predominance (see above). In this defect, hypertrophy and dilation of the atria are expressed by an increase in the P wave. In mitral valve insufficiency, a slight predominance of the left ventricle is usually observed on the electrocardiogram. In lesions of the aortic valve, a sharp predominance of the left ventricle appears on the electrocardiogram. In tricuspid valve insufficiency, there is a predominance of the right ventricle on the electrocardiogram due to its dilation and hypertrophy. In stenosis of the right atrioventricular orifice, the atrial P wave of the electrocardiogram increases due to hypertrophy of the right atrium. Insufficiency of the pulmonary valve causes predominance of the right ventricle. Stenosis of the pulmonary artery orifice causes, in addition to right ventricular predominance, an increase in the P wave due to hypertrophy and dilation of the right atrium. In combined defects, the shape of the electrocardiogram depends on the degree of dilation of the individual heart chambers. Uniform dilation of both ventricles does not affect the shape of the electrocardiogram. The predominance of dilation of one ventricle over the dilation of the other is reflected accordingly on the electrocardiogram. In defects, deformation of individual waves of the electrocardiogram does not occur until degenerative changes appear in the myocardium. Degenerative changes in the myocardium cause deformation of individual waves of the electrocardiogram, primarily T and P. For congenital lesions of the cardiovascular system (see Heart defects, congenital defects), the shape of the electrocardiogram characteristic of right ventricular predominance was considered typical. Careful analysis has shown that in congenital defects, as in acquired ones, predominance of either the right or left ventricle is observed depending on the predominant dilation of individual ventricles. In atrial septal defect, the electrocardiogram is usually unchanged. In other congenital defects, the changes in the electrocardiogram are the same as in acquired ones. Electrocardiography has acquired great importance in the diagnosis of acute myocarditis, especially rheumatic. Acute rheumatic myocarditis, as shown by numerous studies by foreign and Russian (Fogelson, Lukomsky, Etinger and Nezlin, Grotel) authors, causes a change in the electrocardiogram, and these changes are sometimes the only indication of the onset of acute myocarditis. All waves of the electrocardiogram can change, and based on the nature of these changes, it is sometimes possible to make a topical diagnosis of the lesion. The atrial P wave in rheumatic myocarditis is sometimes notched or split, sometimes it decreases up to its complete disappearance. The change in the P wave is due to the fact that, due to significant damage to the atrial myocardium, the propagation and passage of the impulse through the atria are significantly hindered. The initial part of the ventricular complex (QRS) also sometimes changes. In this case, the QRS widens and becomes notched and often decreases significantly in amplitude. Widening and notching of the QRS indicates, as already noted, diffuse damage to the ventricles. The decrease in QRS amplitude is associated with predominant damage to the peripheral endings of the conduction system. Sometimes, simultaneously with the change in QRS or in isolation, the final part of the ventricular complex—T—changes. The T wave in this case may decrease, become diphasic, or negative. Occasionally, in acute rheumatic myocarditis, changes in the electrocardiogram characteristic of occlusion of the coronary artery branches (see below) are observed, consisting of an upward-curved S-T interval, passing into a negative T. These changes in the electrocardiogram are apparently associated with the occlusion of the coronary artery ramifications that sometimes occurs during acute rheumatic myocarditis. Very often (in 90 percent or more) in rheumatic myocarditis, a prolongation of the P-Q interval is observed, caused by impaired impulse conduction between the atria and ventricles. Significantly less often, a gradual prolongation of the R-Q interval and complete dropping of the ventricular complex after a certain number of contractions (Wenckebach periods) and a complete break between atrial and ventricular contractions—complete atrioventricular block—are observed. In acute rheumatic myocarditis, other types of rhythm disturbances are sometimes observed: extrasystole, predominantly ventricular, sinus arrhythmia; less often atrial fibrillation, interference dissociation, nodal rhythm, and short attacks of paroxysmal tachycardia.
All these changes in the electrocardiogram and rhythm disturbances last, for the most part, not long, sometimes one or two days, therefore they are registered only in those cases when careful electrocardiographic observation is conducted. With the improvement of the patients' condition, the electrocardiogram usually quickly returns to normal. A complete parallelism between the degree of electrocardiogram changes and the character of rhythm disturbances and the severity of the disease cannot be established. Sometimes severe myocarditis is accompanied only by insignificant changes in the electrocardiogram in the absence of rhythm disturbances. Significantly less often, changes in the electrocardiogram are observed in other acute infectious diseases: scarlet fever, diphtheria, typhoid fever (Aryev and Tigi), pneumonia (Lukomsky), influenza (Fogelson), etc. The character of these changes is the same as in rheumatic myocarditis, but they are expressed significantly less. It is very important, and this must be emphasized, that the appearance of changes in the electrocardiogram and rhythm disturbances during the course of an acute infectious disease indicate a complication of the disease with acute myocarditis. In chronic lesions of the myocardium, the change in the shape of the electrocardiogram waves depends on the size and character of the degenerative changes of the myocardium. In cardiosclerosis (arteriosclerotic myocardiosclerosis), a predominance of the left ventricle is usually observed. With significant myocardial damage, a biphasic nature of the T wave appears in all leads. In long-lasting hypertension, accompanied by degenerative changes of the myocardium, there is also a predominance of the left ventricle and a biphasic nature of the T wave. Dry pericarditis does not cause changes in the electrocardiogram. Effusive pericarditis causes a sharp decrease in all waves of the electrocardiogram. In the presence of pericardial adhesions fixing the heart, the changes in the shape of the electrocardiogram characteristic of a healthy heart when changing position are absent. Changes in the electrocardiogram are characteristic in acute occlusion of the branches of the coronary arteries (see Heart). 12-30 hours after the occlusion, the ventricular complex of the electrocardiogram changes sharply (Fig. 23). The descending limb of the R wave does not descend to the zero line and, without having covered even 1/2 of the way, passes into the T wave. Thus, a high standing of the S-T interval above the zero line is obtained. Such a change in the electrocardiogram lasts for a very short time, usually 1-3 days, sometimes only a few hours. Then the descending limb of the R wave gradually descends to the zero line. The S-T interval forms an upward-directed arc, which passes into a negative T wave with a pointed apex. Such a "coronary" T wave according to Pardee usually lasts 1-3 months, sometimes it is observed for years after the suffered occlusion. As a result of the occlusion, sometimes a widening and notching of the initial part of the ventricular complex and an electrocardiographic picture characteristic of bundle branch block are obtained. A number of American authors (Wilson, Levine, et al.) point out that myocardial infarctions are often accompanied by a low Q, predominantly in the third lead. A low Q is indeed very often observed after infarctions, and an electrocardiographic picture characteristic of left ventricular predominance is obtained. However, a low Q is also observed in other diseases that cause left ventricular predominance. Besides the change in the ventricular complex, sometimes in infarctions an increase in the atrial P wave is also observed. After the occlusion, various types of rhythm disturbances often appear. The most frequent form of disturbed rhythm is extrasystole, especially ventricular. Less often, various types of blocks and atrial fibrillation are observed. The electrocardiographic picture sometimes makes it possible to localize the site of the occlusion. If the branches lying on the anterior surface of the heart are occluded, then the change in the electrocardiogram is observed in lead I; if the branches located on the posterior surface are occluded, then the changes in the electrocardiogram occur in leads II and III. The appearance of atrioventricular block indicates an occlusion of a branch of the right coronary artery (r. septi fibrosi) and damage to the interventricular septum. The appearance of atrial fibrillation is also usually associated with damage to the right coronary artery. A change in the electrocardiogram can occur in lesions localized outside the cardiovascular system when they are reflected in the activity of the heart. Thus, pulmonary emphysema and a long-lasting chronic tubercular process, by causing hypertrophy and dilation of the right ventricle, are reflected in the electrocardiogram by a predominance of the right ventricle. In obesity and hyperthyroidism, a predominance of the left ventricle is observed. In hyperthyroidism, furthermore, due to an increase in the tone of the sympathetic nerve, an increase in the P and T waves is observed. In hypothyroidism, the amplitude of the electrocardiogram waves is reduced, and the P and T waves are flattened. Summarizing everything said about electrocardiography, it must be admitted that this method is the most valuable method for examining the heart. But electrocardiography does not make it possible to judge the state of circulation as a whole, because it characterizes issues of circulation only insofar as they are reflected in the heart. L. Fogelson.
Related articles
Mentioned in
Cite this page
“Electrocardiography.” Soviet Medical Encyclopedia. English translation of Bolshaya Meditsinskaya Entsiklopediya, 1st ed. (Moscow, 1928–1936), ed. N. A. Semashko. https://sovietmedicalencyclopedia.pages.dev/article/electrocardiography/